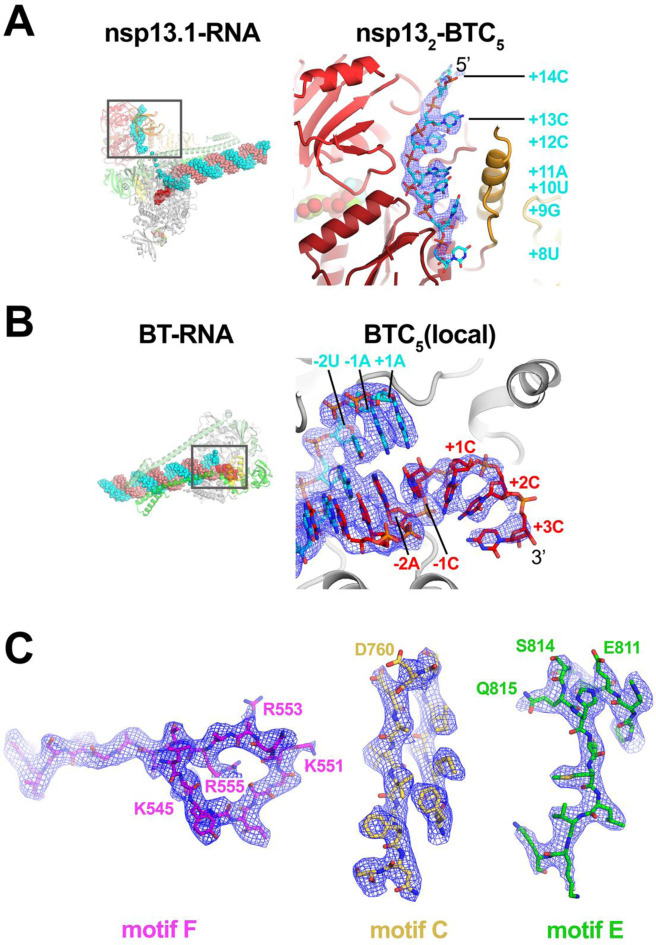
Fig. 2. Cryo-EM density maps.
A. (left) Overall view of nsp131-BTC5. The boxed region is magnified on the right. (right) Magnified view of the t-RNA segment (+14–5’-CCCAUGU-3’-+8) enclosed in the nsp13.1 helicase subunit. The cryo-EM density map (from the nsp132-BTC structure) for the RNA is shown (blue mesh).
B. (left) Overall view of the BTC structure. The boxed region is magnified on the right.
(right) Magnified view of the region around the RdRp active site, showing the t-RNA (cyan) and p-RNA (red) with the backtracked RNA segment. The cryo-EM density map for the RNA [from BTC5(local)] is shown (blue mesh).
C. BTC5(local) cryo-EM density maps around nsp12 conserved motifs F, C, and E. Selected residues are labeled.

