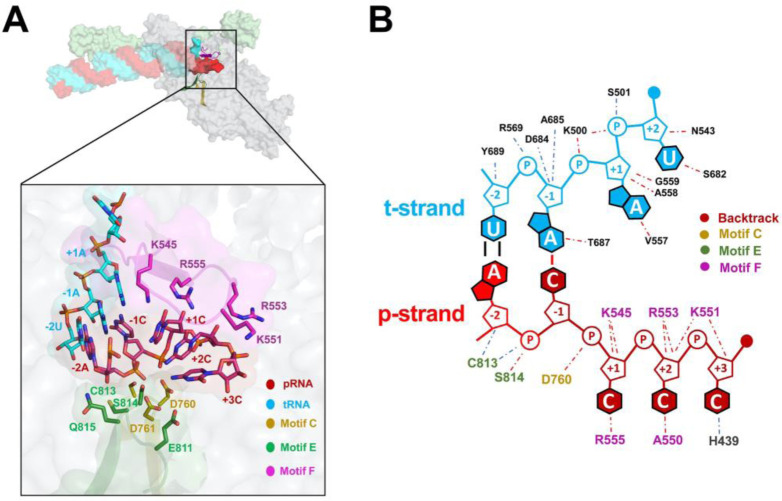
Fig. 4. Protein-RNA interactions in the BTC.
A. (top) Overall view of BTC5(local). Proteins are shown as transparent molecular surfaces, nucleic acids as atomic spheres. Nsp8a and nsp12 are shown (nsp7 and nsp8b are removed for clarity). Nsp12 motifs C, E, and F are shown as backbone ribbons (colored according to the key on the bottom. The boxed region is magnified below.
(bottom) RNA is shown from −2 to +3. Proteins are shown as transparent molecular surfaces. RdRp motifs C, E, and F are shown as transparent backbone ribbons (colored according to the key) with side chains of residues that approach the backtracked RNA (≤ 4.5 Å) shown.
B. Schematic illustrating the same protein-RNA interactions as (A). Drawn using Nucplot (49).

