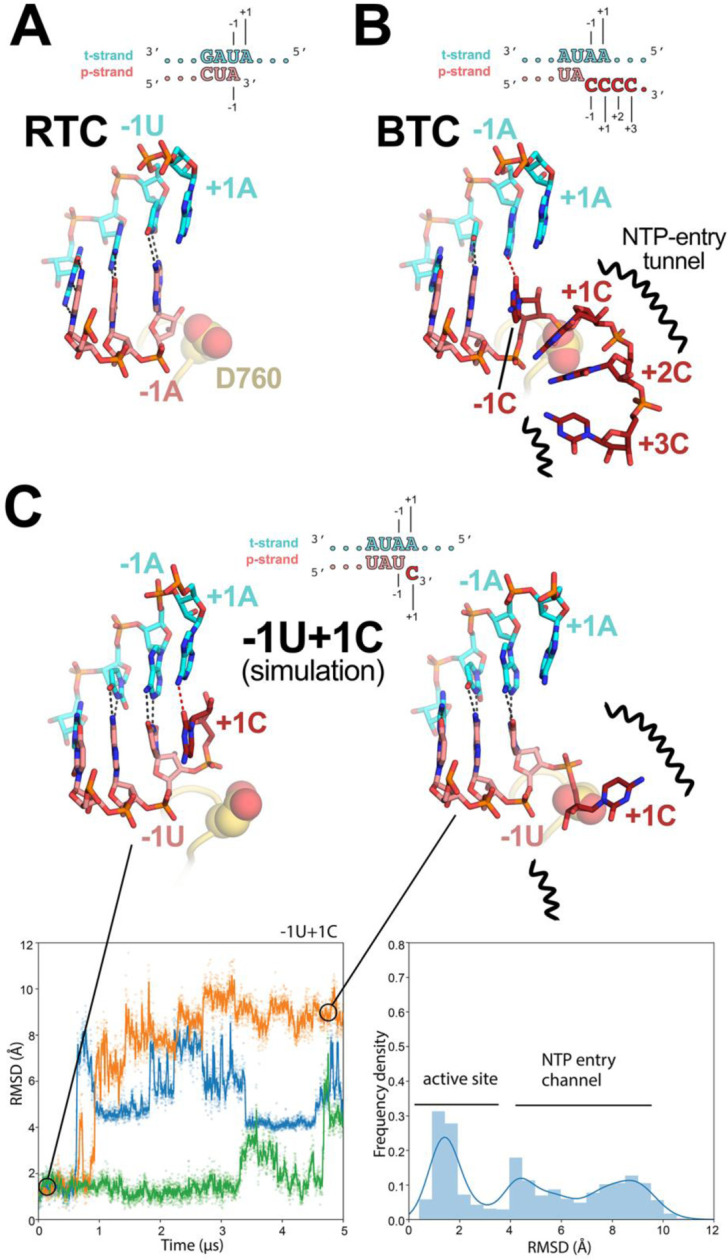
Fig. 5. Comparison of active-site proximal RNA in the RTC and BTC structures, and from simulations of a mismatched nucleotide at the p-RNA 3’-end.

A-B, Comparison of the active-site proximal RNA in the RTC [A; PDB ID: 6XEZ; (14)], BTC5(local) (B), and from selected snapshots of molecular dynamics simulations of a −1U+1C complex (C). The schematics denote the nucleotides shown in the context of the RTC- (A) and BTC5-scaffolds (B; full scaffold sequences shown in Figure 1A) or generated from the BTC5-scaffold for the simulations (C). Carbon atoms of the t-RNA are colored cyan, p-RNA are colored salmon except in the case of mismatched C’s at the 3’-end, which are colored dark red. Watson-Crick base pairing hydrogen-bonds are denoted as dark gray dashed lines, other hydrogen-bonds as red dashed lines. Nsp12 motif C is shown as a yellow-orange backbone ribbon, and the side-chain of D760 is shown as atomic spheres.
A. The RTC is in a post-translocated state, with the A-U base pair at the p-RNA 3’-end in the −1 position (14).
B. The BTC5(local) RNA is translocated compared to the RTC; the base pair corresponding to A-U at the 3’-end of the RTC RNA in the −1 position is in the −2 position of the BTC RNA. A C-A mismatch occupies the BTC −1 site. The +1, +2 and +3 mismatched C’s trail into the RdRp NTP-entry tunnel (denoted by black squiggly lines). The +4C (present in the BTC5-scaffold; Figure 1A) is exposed to solvent, disordered and not modelled.
C. Molecular dynamics simulations of the nsp132-BTC−1U+1C complex. The complex was simulated with 3 replicates. RMSD values plotted as a function of time represent the heavy-atom RMSD of the +1C of the p-RNA compared with the starting configuration (see Methods). The RMSD histograms (plotted on the right) are an aggregate of all three replicates. Two structures taken from one of the simulations are shown, one showing the +1C of the p-RNA in the active site (t = 0 μs) and the other showing the +1C frayed into the NTP-entry tunnel (t = 4.5 μs).
