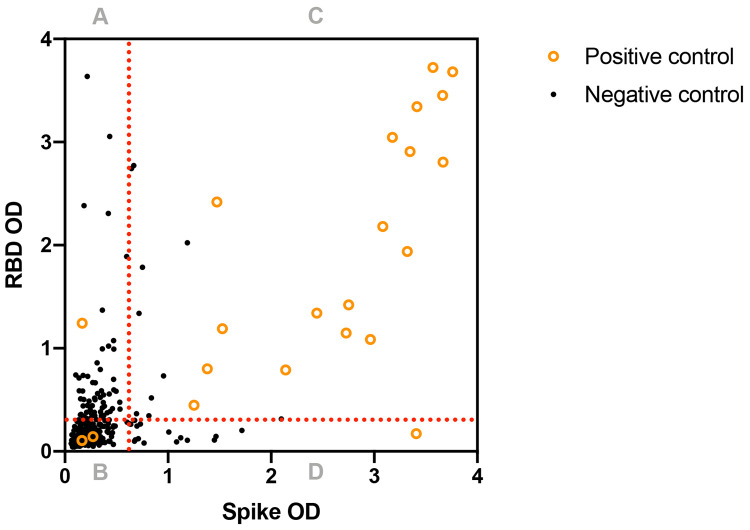
Figure 5:
The performance of US cutoffs in Malian positive control (n=23) and negative control (n=311) samples.
OD: optical density, RBD: receptor binding domain
Dotted lines represent US assay cutoffs for spike protein: 0.674 and RBD: 0.306 [14].
Quadrant A (spike negative, RBD positive): positive control: 1/23, negative control: 65/311
Quadrant B (spike negative, RBD negative): positive control: 3/23, negative control: 225/311
Quadrant C (spike positive, RBD positive): positive control: 18/23, negative control: 8/311
Quadrant D (spike positive, RBD negative): positive control: 1/23, negative control: 13/311

