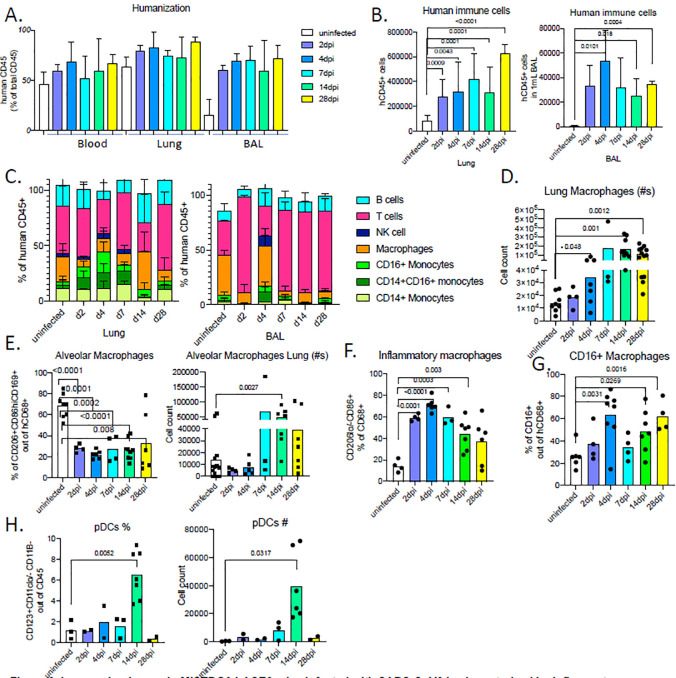
Figure 2. Immune landscape in MISTRG6-hACE2 mice infected with SARS-CoV2 is characterized by inflammatory macrophages and monocytes.
A. Humanization measured by ratio of human CD45+ cells in total CD45+ cells (mouse and human CD45+ combined) in blood, lung and BAL of uninfected and infected MISTRG6-hACE2 mice. N=4–12.
B. Human immune cell numbers in lungs and BAL of uninfected and infected mice at 2,4,7,14,28 dpi. N=4–12. Unpaired, two-tailed t-test. Only P-values <0.05 are plotted.
C. Human immune lineages lungs and BAL of uninfected and infected mice at 2,4,7,14,28 dpi within the human CD45+ population. Classical monocytes (CD14+), Intermediate monocytes (CD14+CD16), non-classical monocytes (CD16+CD14−), macrophages (CD68+), NK cells (NKP46+), T cells (CD3+), B cells (CD19+ and/or CD20+). N=4–12. Means with SD are plotted.
D. Number of human macrophages in lungs of uninfected and infected mice at 2,4,7,14,28 dpi. N=4–10. Unpaired, two-tailed t-test.
E. Frequency and number of human alveolar macrophages marked by CD206hi, CD86+, CD169+ expression within the hCD45+CD68+ population in the lungs of uninfected and infected mice at 2,4,7,14,28 dpi. N=3–10. Unpaired, two-tailed t-test.
F. Frequency of inflammatory human lung macrophages marked by CD206-/lo, CD86hi macrophages within the hCD45+CD68+ population in the lungs of uninfected and infected mice at 2,4,7,14,28 dpi. N=3–10. Unpaired, two-tailed t-test. P values<0.05 plotted.
G. Frequency of CD16+ human lung macrophages marked by CD16+ macrophages within the hCD45+CD68+ population in the lungs of uninfected and infected mice at 2,4,7,14,28 dpi. N=4–8. Unpaired, two-tailed t-test. P values<0.05 plotted
H. Frequency and number of human pDCs marked by CD123+ CD11b− CD11c−/lo cells withing hCD45+ population in the lungs of uninfected and infected mice at 2,4,7,14,28 dpi
Means of at least 3 independent experiments are presented. Mean with SD or individual values are plotted.

