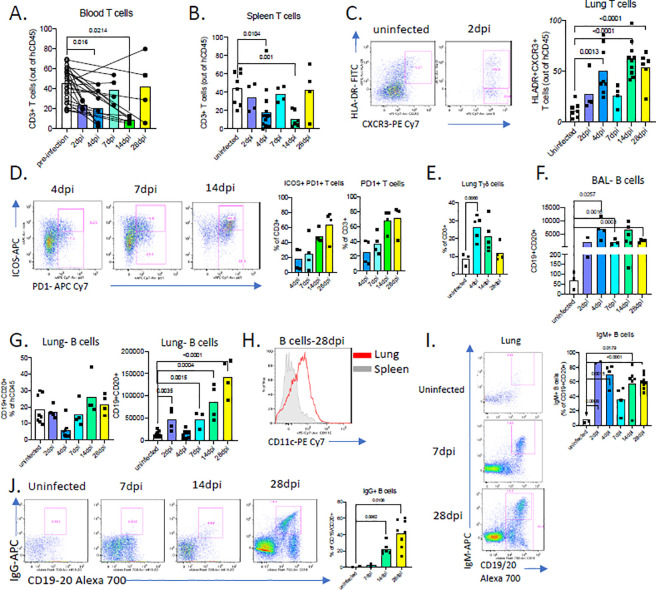
Figure 3. COVID-19 in MISTRG6 presents with systemic T cell lymphopenia.
A. Frequencies of human CD3+ T cells within human CD45+ population in the blood pre and post-infection (2,4,7,14,28dpi). Lines connect pre and post-infection values for the same mouse. Paired, two-tailed t-test. N=4–6 per infection time point. P-values<0.05 are plotted.
B. Frequencies of human CD3+ T cells within human CD45+ population in the spleens of uninfected and infected mice at 2,4,7,14,28 dpi. Mean of at least three independent experiment. Unpaired, two-tailed t-test. N=4–14 per infection time point. P-values<0.05 are plotted.
C. Representative flow cytometry plots of HLA-DR and CXCR3 expression on human lung T cells and frequencies of HLA-DR+CXCR3+ lung T cells in uninfected and infected mice at 2,4,7,14,28dpi. N=4–10. Unpaired, two-tailed t-test. P-values<0.05 are plotted.
D. Representative flow cytometry plots of ICOS and PD1 expression on human lung T cells and frequencies Icos+ PD1+ or PD1+ T cells in uninfected and infected mice (4,7,14,28dpi). N=4.
E. Frequencies of TCRgamma/delta T cells among human lung T cells in uninfected and infected mice (4,14,28dpi). N=3–5. P-values<0.05 are plotted.
F. Numbers of human B cells in the BAL of uninfected or infected mice at 2,4,7,14,28 dpi. N=3–6. Unpaired, two-tailed t-test. P-values<0.05 are plotted.
G. Frequencies and numbers of human B cells within hCD45+ population in the lungs of uninfected or infected mice at 2,4,7,14,28 dpi. N=4–8. Unpaired, two-tailed t-test. P-values<0.05 are plotted.
H. CD11 c expression on CD19+ B cells from spleen and lungs of infected mice at 28dpi. N=4
I. Representative flow cytometry plots and frequencies of IgM+ B cells in the lungs of uninfected and infected mice 2,4,7,14,28dpi. N=2–8
J. Representative flow cytometry plots and frequencies of IgG+ B cells in the lungs of uninfected and infected mice 7,14,28dpi. N=2–8

