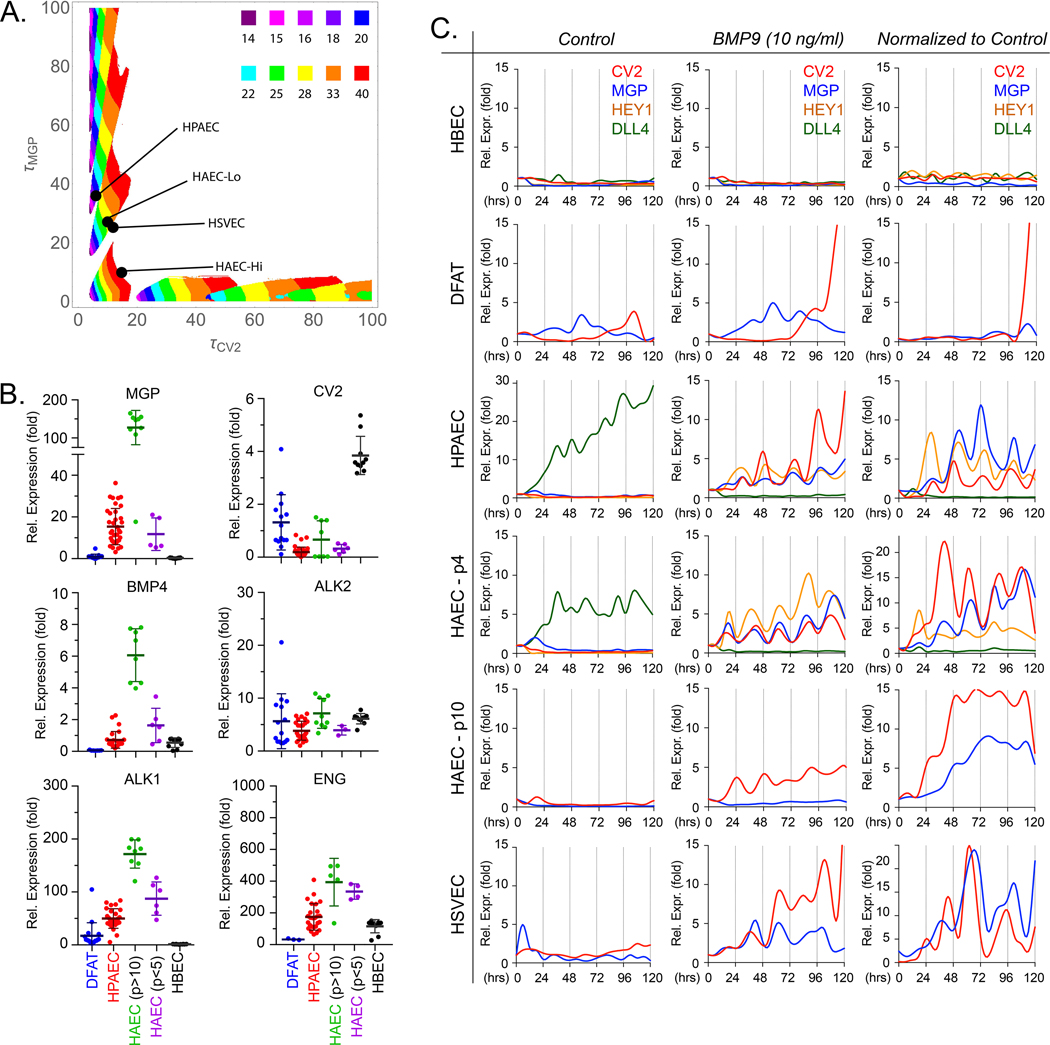
Figure 1: Baseline characteristics of endothelial cells.
(A) Phase diagram: time delays and the system’s temporal behaviors. The diagram is the result of 250,000 simulations, a 500 X 500 sampling of the 2-dimensional phase space spanned by τCV2 and τMGP. Given a pair of values for τCV2 and τMGP, the diagram shows when the model predicts oscillatory behavior, and the period of the resulting oscillation, if any. (B) Baseline expression of MGP, CV2, BMP4, ALK2, ALK1 and ENG in endothelial progenitor cells (DFAT cells) and different preparations of endothelial cells under normal culture conditions, as determined by qPCR. Horizontal bars represent mean ± SD. (C) Temporal oscillations of CV2 and MGP in different endothelial cells. Expression profiles for CV2 and MGP in HBEC, DFAT cells (EC progenitors), HPAEC, HAEC-passage 10 or HAEC-passage 4 and HSVEC with no treatment (first column), 10 ng/ml of BMP9 (second column). The third column represents BMP9 treatment where each data point has been normalized to its own untreated control. The stalk cell marker HEY1 and the tip cell marker DLL4 are included in the graphs for HBEC, HPAEC, and HAEC-passage 4. RNA was collected every 6 hours for up to 120 hours. Each time point represents the mean of 3 determinations by qPCR, first normalized to GAPDH and then to its own control; 3–8 replicate experiments were performed for each type of EC.
DFAT cells, dedifferentiated cells; EC, endothelial cells; HPAEC, human pulmonary artery EC; HAEC, human aortic EC; HUVEC, human umbilical vein EC; HBEC, human brain EC; HSVEC, human saphenous vein EC; p, passage.

