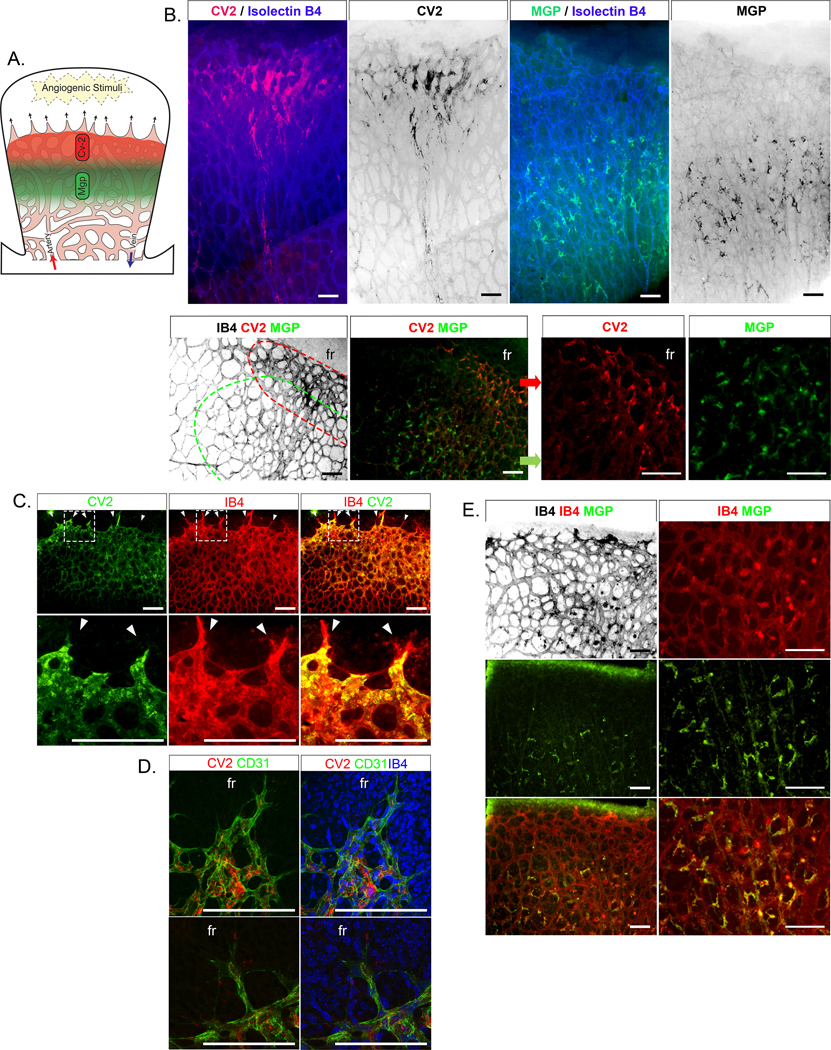
Figure 5: Distribution of CV2 and MGP in retinal angiogenesis (postnatal day 7, P7).
(A) Working model of growing retina with zones of CV2 and MGP. (B) (Left top) Immunofluorescence showing CV2 staining (red) together with Isolectin B4 (IB4) staining (blue) close to the retinal front (up) of mouse retinal vasculature; (Right top) MGP staining (green) together with IB4 staining (blue) away from the front. The bottom panels similarly show CV2 staining (red) and MGP staining (green) in two zones with CV2 closest to the front. (C) Close up of the vascular front; immunofluorescence showing CV2 staining (green) together with IB4 staining (red). No CV2 is detected in the tip cells (white arrows). (D) Confocal microscopy showing CV2 staining (red) together with CD31 staining (green) in cells next to the tip cells. fr, front. (E) Immunofluorescence showing MGP staining (green) together with IB4 staining (red).
All bars, 200 μm; each panel is representative of ≥ 3 replicate experiments.

