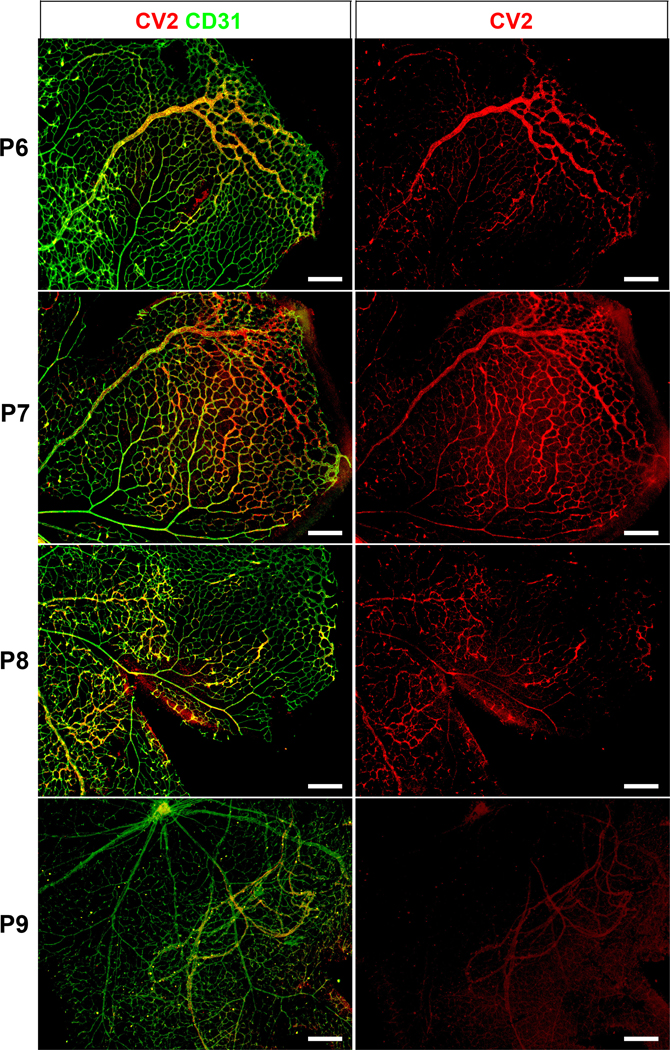
Figure 6: Distribution of CV2 in retinal angiogenesis (postnatal day 6–9).

Immunofluorescence showing CV2 (red) merged with CD31 (green) (left panels). The right panels show CV2 staining (red) alone. The location of the CV2 staining moves from the angiogenic front on P6 towards the middle of the retina, and disappears on P9. P, postnatal. All bars, 200 μm; each panel is representative of ≥ 3 replicate experiments.
