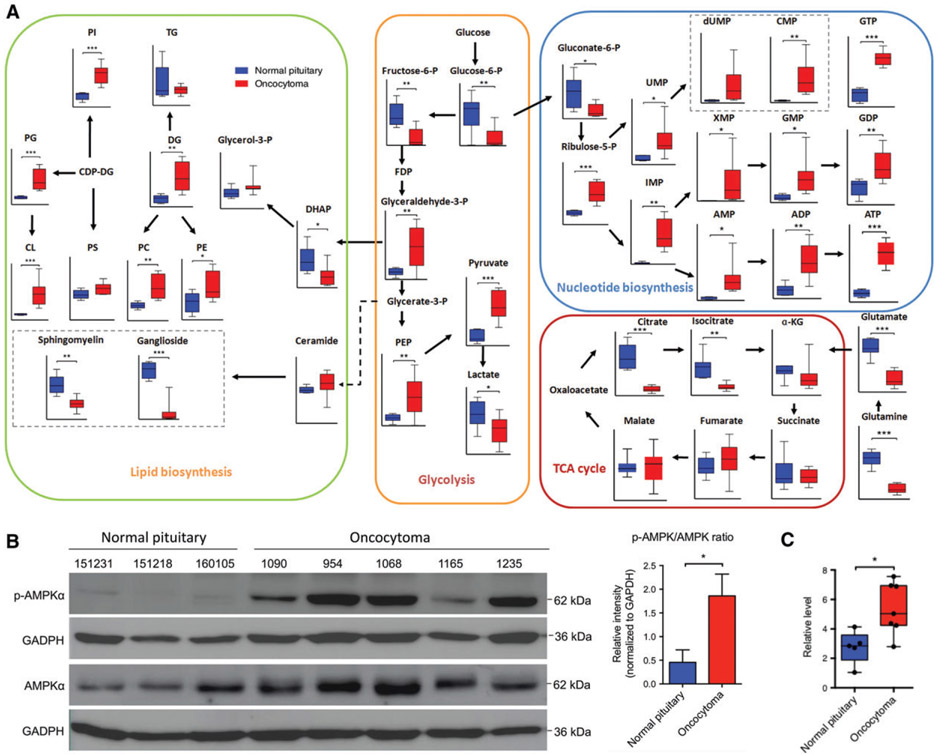
Figure 2.
An aberrant metabolic phenotype in oncocytomas with inhibited oxidative phosphorylation and inappropriately downregulated glycolysis. (A) Metabolomic analysis revealed reduced TCA cycle flux, increased nucleotide and phospholipid synthesis, and inappropriately downregulated glycolysis with low lactate levels in oncocytomas (n = 7 and n = 10 for normal pituitary and oncocytoma, respectively). (B) Oncocytomas had an elevated p-AMPKα/AMPKα ratio (n = 3 and n = 5 for normal pituitaries and oncocytomas, respectively). (C) The NAD+/NADH ratio was significantly higher in oncocytomas (n = 7) than in the normal pituitary (n = 5). *p < 0.05; **p < 0.01; ***p < 0.001. CDP-DG, Cytidine Diphosphate Diacylglycerol; CL, Cardiolipin; DG, Diacylglycerol; DHAP, Dihydroxyacetone phosphate ; FDP, Fructose Diphosphate ; PC, Phosphatidylcholines; PE, Phosphatidylethanolamine; PEP, Phosphoenolpyruvate; PG, Phosphatidylglycerol; PI, Phosphatidylinositol; PS, Phosphatidylserine ; TG, Triglycerid.

