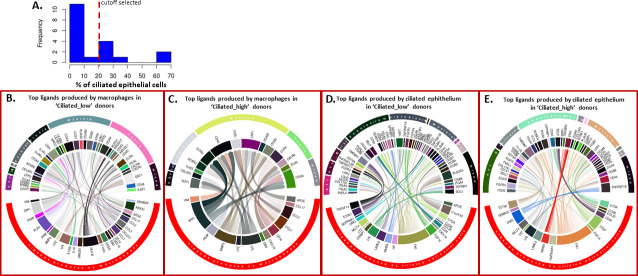
Fig 7. Ligand-receptor networks in ‘Ciliated_low’ and ‘Ciliated_high’ donors in GSE135893 (Kropski-Vanderbilt Univ single cell cohort) [24].
A. Histogram of distribution of percentage of ciliated epithelial cells in GSE135893 (Kropski-Vanderbilt Univ single cell cohort) [24] with the cutoff we selected indicated. B-E. Circular plots indicating ligand receptor interactions in subsets of patients in GSE135893 (Kropski-Vanderbilt Univ single cell cohort) [24]. On each circular plot, the top half of the circle represents cell types expressing the receptor for the ligand of the indicated cell type on the bottom half of the plot. Connections represent inferred active ligand-receptor pairs between types of cells. The thickness of the lines represents the relative level of expression of a given ligand/receptor. Transparency of the lines represents relative strength of the given ligand-receptor interaction as reported by the z score value calculated by PyMiner. B. Top ligands produced by macrophages (bottom half of circle) in ‘Ciliated_low’ patients and the top receptors they interact with (top half of circle with cell types expressing the receptor indicated). C. Top ligands produced by macrophages (bottom half of circle) in ‘Ciliated_high’ patients and the top receptors they interact with (top half of circle with cell types expressing the receptor indicated). D. Top ligands produced by ciliated epithelial cells (bottom half of circle) in ‘Ciliated_low’ patients and the top receptors they interact with (top half of circle with cell types expressing the receptor indicated). E. Top ligands produced by ciliated epithelial cells (bottom half of circle) in ‘Ciliated_high’ patients and the top receptors they interact with (top half of circle with cell types expressing the receptor indicated).

