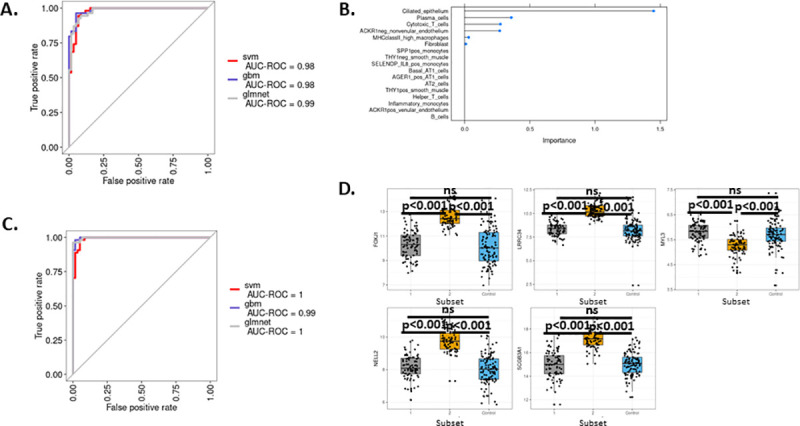
Fig 8. Building a machine learning-based classifier for distinguishing subclasses in GSE47460 (Kaminski-LGRC bulk expression cohort) [14–17].

A. ROC curve of classifier from three different methods used based on cell signature data. Legend indicates names of machine learning (svm, gbm, glmnet) used. B. Relative importance of cell types identified by the elastic net model sorted by importance. C. ROC curve of classifier from three different methods used based on gene expression data. Legend indicates names of machine learning (svm, gbm, glmnet) used. D. Expression values of top 5 genes identified by recursive feature elimination across subsets of patients in GSE47460 (Kaminski-LGRC bulk expression cohort) [14–17]. Adjusted p values are reported on plots.
