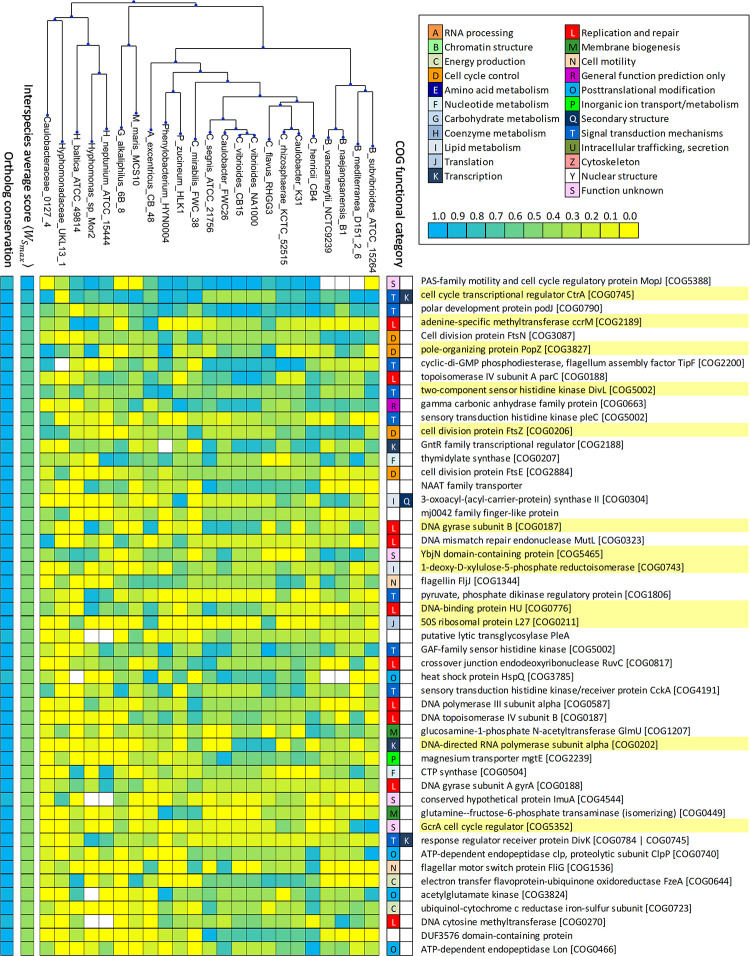
Fig 5. Heatmap showing top 50 ranked highly conserved ortholog groups for Caulobacteraceae and Hyphomonadaceae families.
Each column designates a species, following the order dictated by a phylogenetic tree inferred from a multiple sequence alignment of GcrA homologs. Rows correspond to identified orthologous groups. For each cell, the cyan-yellow scale coloring indicates the posterior probability of regulation of the ortholog in that species (cyan blue—1, yellow—0). White cells indicate absence of the ortholog in that particular species. The left ancillary columns indicate, using the same color scale, the number of orthologs in each ortholog group (lowest value 20 out of 23) and the inter-species average of best extended GANTC instance score , which has been used to rank the ortholog groups. Both values are shown normalized to the (0,1) range. The right ancillary columns indicate the two primary functional categories for the COGs assigned to each ortholog group, the description and identifier of which is shown adjacent. Highlighted descriptions denote ortholog groups also present in Fig 6.

