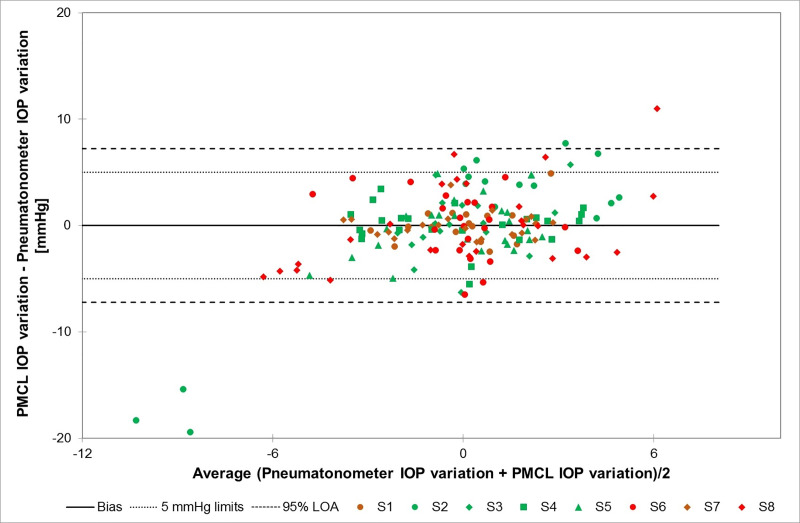
Fig 3. Bland-Altman plot illustrating the relationship between PMCL and pneumatonometry IOP variations in the fellow eyes of each subject through all measurement timepoints.
Different colours (green for healthy subjects; red and brown for glaucoma patients) and shapes are used for each subject (S1-S8). (PMCL: pressure-measuring contact lens; IOP: Intraocular pressure; LOA: Limits of agreement).

