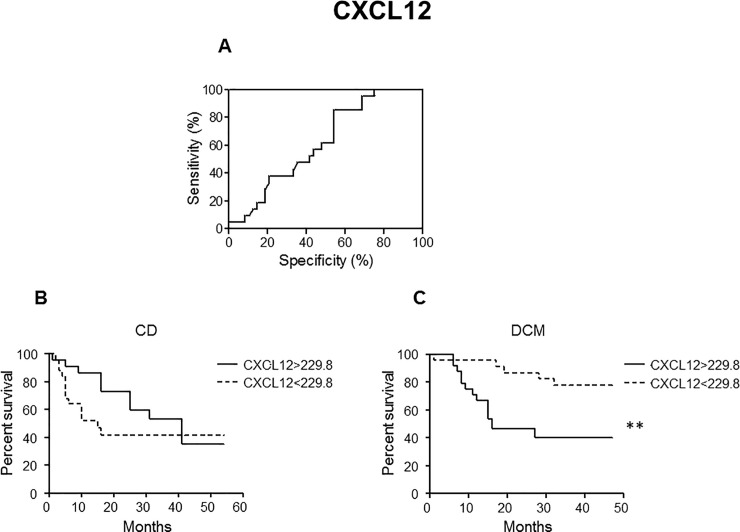
Fig 3. ROC and Kaplan-Meier curves (CXCL12).
A. ROC curve was used to define cut-off value for CXCL12 with best sensitivity and specificity based on CD patients in NYHA classes I-IV (Sensitivity: 85.71%; Specificity: 45.83%). The cut-off value was calculated to be 229.8 pg/mL. B, C. Kaplan-Meier survival curves were generated to compare percent survival in CD (B) and DCM (C) patients with CXCL12 higher or lower than cut-off value (cut-off = 229.8 pg/mL); ** p < 0.01. Statistical analysis were carried out by log-rank test.

