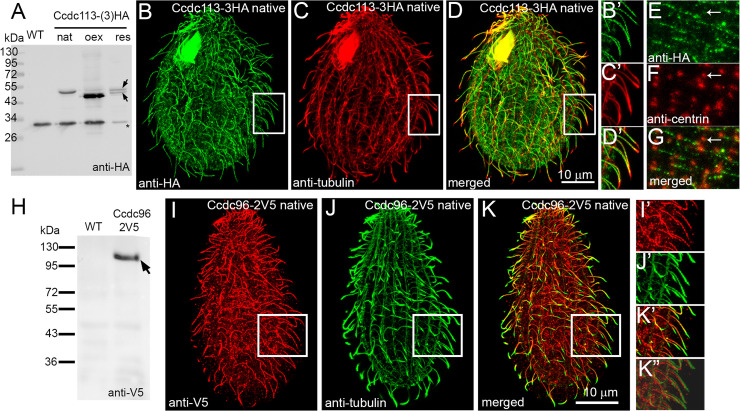
Fig 2. Ccdc113 and Ccdc96 localize in cilia but not at the ciliary tips.
(A) Western blot of the ciliary proteins isolated either from wild-type cells (WT) or cells expressing HA-tagged Ccdc113 under the control of a native promoter (native level, nat, with 3HA) or the MTT1 promoter (overexpression, oex, with single HA), or rescued cells (res, 3HA). Note the presence of two co-migrating bands (arrows), suggesting post-translational modifications of Ccdc113 protein (see also S4A Fig). A star indicates a band which is non-specifically recognized by the secondary antibodies (serving as a loading control). (B-G) Immunofluorescence confocal images of Tetrahymena cells expressing Ccdc113-3HA at the native level, double labeled with anti-HA (B, B’ and E) and either anti-α-tubulin (C, C’) or anti-centrin (F) antibodies. (D, D’ and G) Merged images. Note the absence of Ccdc113 at the cilia tips. (B’, C’, D’) The magnified cilia marked with white insets on B, C, and D. Scale bar = 10 μm. (H) Western blot of ciliary proteins isolated from WT cells and cells expressing Ccdc96-2V5 under the control of its native promoter. Arrow indicates the position of the Ccdc96-2V5 protein. (I-K”) Immunofluorescence confocal images of Tetrahymena cells expressing Ccdc96-2V5 at the native level, double labeled with anti-V5 (I, I’) and anti-α-tubulin (J, J’) antibodies showing that Ccdc96 protein is distributed along the entire cilium except for the tip. (K-K”) Merged image. (I’, J’, K’, K”) Magnified cilia marked with white inset on I, J and K. (K”) Note the shift in the merged red and green channels enabling better visualization of the region where Ccdc96-2V5 localizes. Scale bar = 10 μm.

