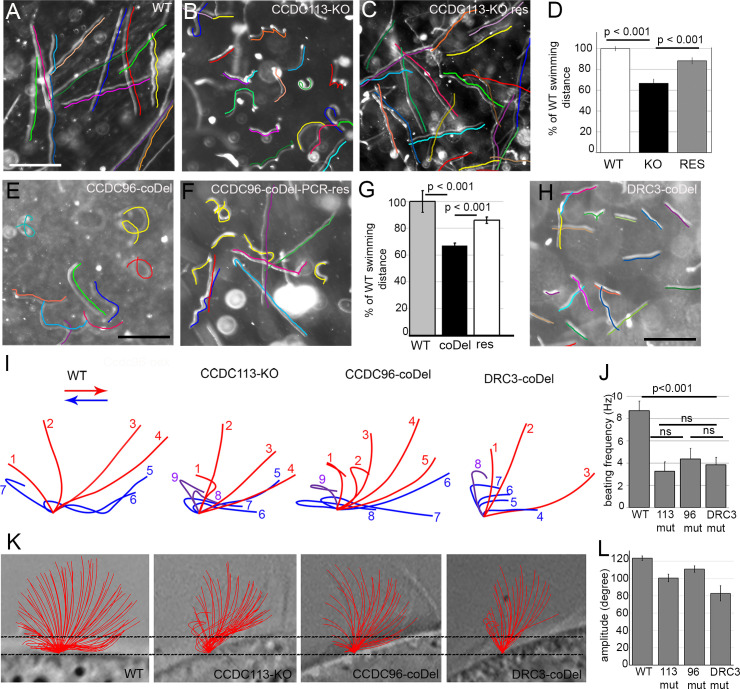
Fig 3. Ccdc113 and Ccdc96 are required for normal ciliary beating.
(A-C) Swimming paths of (A) WT, (B) CCDC113-KO and (C) CCDC113-KO rescued cells recorded for 3.2 s using a video camera. The trajectories are indicated by colored lines; note that the drawn lines were shifted to be positioned parallel to the cell paths and make the original paths visible. Dots are most likely immotile dividing cells. Very short trajectories may represent cells that slowed down in order to change the direction of swimming. Bar = 400 μm. (D) Graph representing the average distance swum by WT, CCDC113-KO mutant (KO) and CCDC113-KO rescued (res) cells expressing Ccdc113-3HA, normalized to WT values. Error bars represent standard error. (E-F) Trajectories of swimming CCDC96-coDel mutant (E) and CCDC96-coDel rescued cells (F) recorded for 3.2 s using a video camera. Trajectories are marked with colored lines. Note that no selection pressure to increase the number of wild-type copies of CCDC96 was applied in rescued mutant and thus some cells have more copies and swam almost as WT cells while others (with low copy number) swam similarly to mutant cells. Bar = 400 μm. (G) Graph representing the average distance swum by WT, CCDC96-coDel mutants (coDel) and CCDC96-coDel rescued (res) cells normalized to the WT value. Error bars represent standard error. (H) Trajectories of swimming DRC3-coDel mutant cells marked with colored lines. Note that DRC3-coDel trajectories are straight while those of CCDC113-KO and CCDC96-coDel mutants are wavy and kinky, suggesting frequent changes in swimming direction. Bar = 400 μm. (I) Drawings representing examples of the observed subsequent positions of a cilium of WT and mutant cells (CCDC113-KO, CCDC96-coDel, DRC3-coDel) during the power (red) and recovery (blue) stroke. The position of the cilium marked in purple represents a cilium that is still bending (as in the recovery stroke) but already lifting up (as in the power stroke). Drawings were prepared using the individual frames extracted from digitized videos of WT and mutant Tetrahymena. Traced cilia were positioned at the middle dorsal region of the cell. (J) Graph representing cilia beating frequency of WT and mutant cells. T-test denotes P value < 0.001. (K) The analyses of the ciliary amplitude. The schematic representation of all recorded consecutive positions of the cilium during the power and recovery stroke. The amplitude was measured as the angle between two most angled positions of the cilium (calculated as the angle of the triangle marked by the intersection points of the cilium with the measuring line and cilium base. (L) Graph representing cilia beating amplitude of WT and mutant cells. T-test denotes P value < 0.001 for CCDC113-KO and DRC3-coDel, and 0.05 for CCDC96-coDel. Numerical data are in S10 Table.

