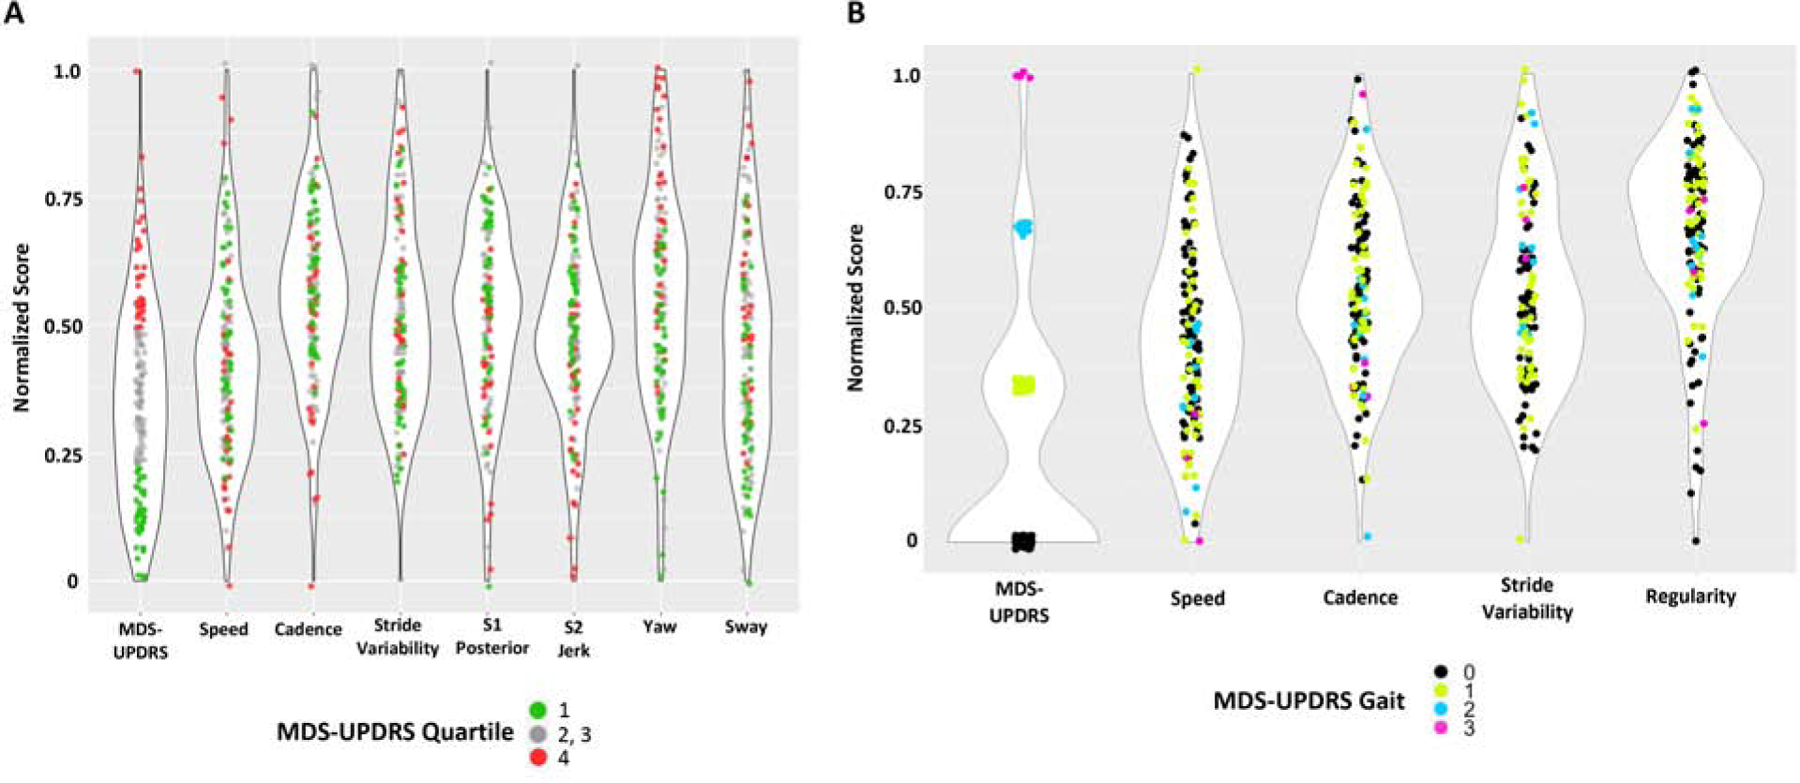
Figure 1. Violin plots of motor MDS-UPDRS versus quantitative mobility measures.

The distribution of subject motor MDS-UPDRS scores is compared with that for quantitative mobility measures. Low scores are normalized to 0 and high scores are normalized to 1 to facilitate comparison. The width of the violin represents the number of data points at that value. (A) Total motor MDS-UPDRS score is compared with the 7 associated quantitative mobility measures (Table 2). Subjects falling within the upper and lower quartile of MDS-UPDRS are displayed in red and green, respectively. (B) The MDS-UPDRS gait item is compared with the quantitative mobility measures from the 32-ft walk task. Subjects are displayed with colors based on the MDS-UPDRS gait item score: 0, black; 1, green; 2, blue; 3, magenta.
