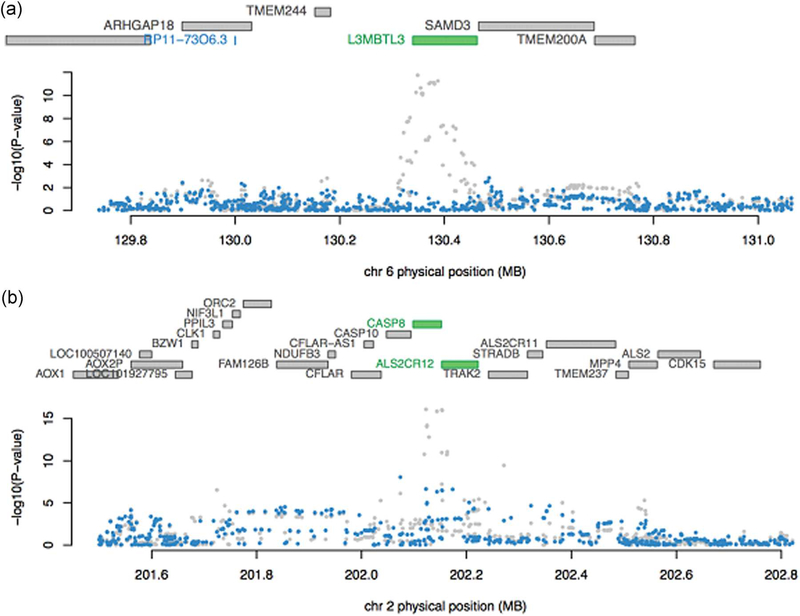
FIGURE 3.
COJO for regions with multiple TWAS associations. For each plot, the top panel shows all genes in the locus. After COJO analysis, the marginally associated genes are highlighted in blue, while those that remain jointly significant are highlighted in green (in this case, L3MBTL3, CASP8, and ALS2C12). The bottom panel shows a Manhattan plot of the GWAS signals before (gray) and after (blue) conditioning on the significant (green) genes. (a) COJO results for 6q22 (only one gene remains significant after COJO). (b) COJO results for 2q33 (an example of multiple genes remaining jointly remain significant after COJO). COJO, conditional and joint analysis; GWAS, genome-wide association studies; TWAS, transcriptome-wide association studies

