
Figure 1.
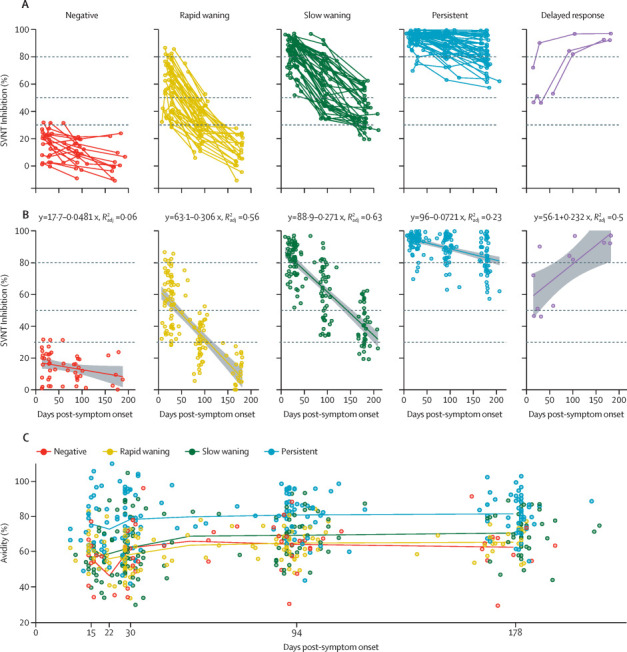
Longitudinal dynamics of neutralising antibodies
(A) Neutralising antibody level, measured by percentage inhibition of sVNT readings. (B) Linear regression model of each grouping for neutralising antibody level. Dashed lines represents 30%, 50%, and 80% of sVNT percentage inhibition. (C) Group mean of IgG avidity percentage is connected at days 14, 21, 30, 90 and 180. Since each patient blood sample was taken at a different timepoint in practice, we marked the mean days post-symptom onset of the samples within the same group but the definition of the time groups remains 14, 21, 30, 90, and 180 days post-symptom onset. Each point represents a single patient. sVNT=surrogate virus neutralisation test.