
Figure 2.
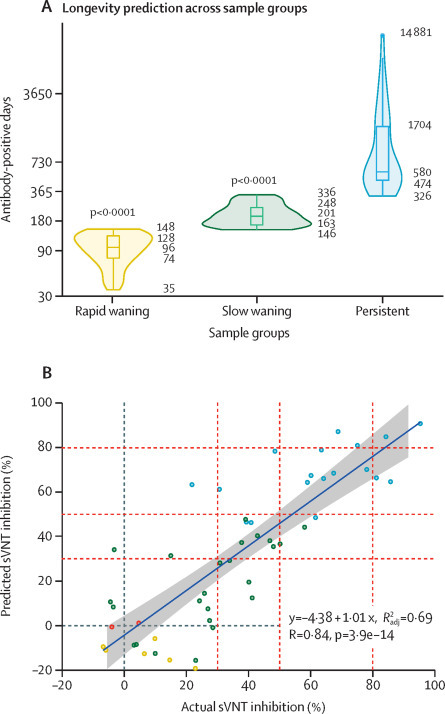
Prediction of neutralising antibody longevity using linear regression modelling for different groups
(A) Violin plots and box plots showing neutralising antibody positive days. p-value was calculated by Wilcoxon signed-rank test with the persistent group as the reference. For each group, the 0th, 25th, 50th, 75th, and 100th percentile are marked. (B) Correlation of predicted sVNT inhibition percentage compared with actual sVNT inhibition percentage for a subset of the returning cohort at 270 days post-symptom onset. sVNT=surrogate virus neutralisation test.