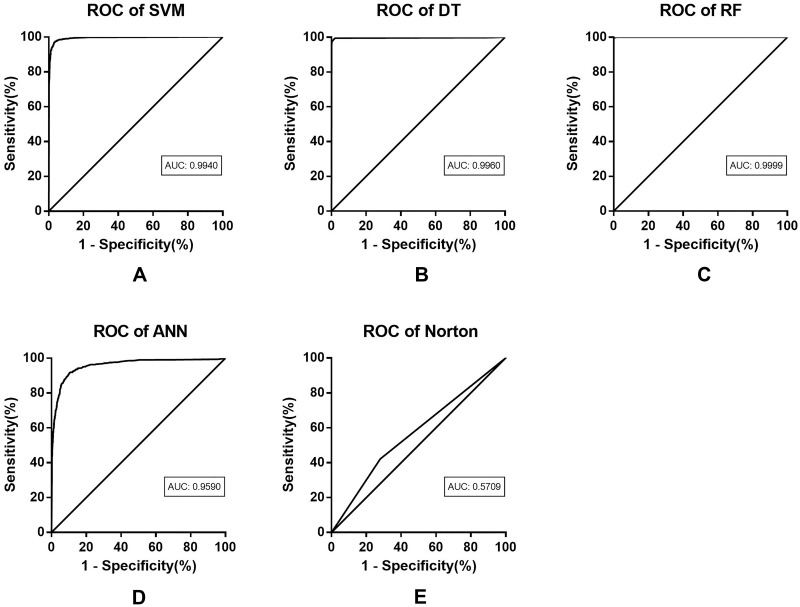
Figure 3.
Performance metrics of pressure ulcer prediction models on the test data set. Based on the prediction results of the model, the ROC curves are drawn, including SVM (A), DT (B), RF (C), and ANN (D). The results are compared with the ROC curve of Norton scale (E). Norton scale is inferior to the machine learning model in terms of ROC curve or AUC value. Graphically, DT and RF achieve similar performance, but RF obtains higher prediction accuracy in terms of AUC value.

