
Figure 3. Potential applications in monitoring.
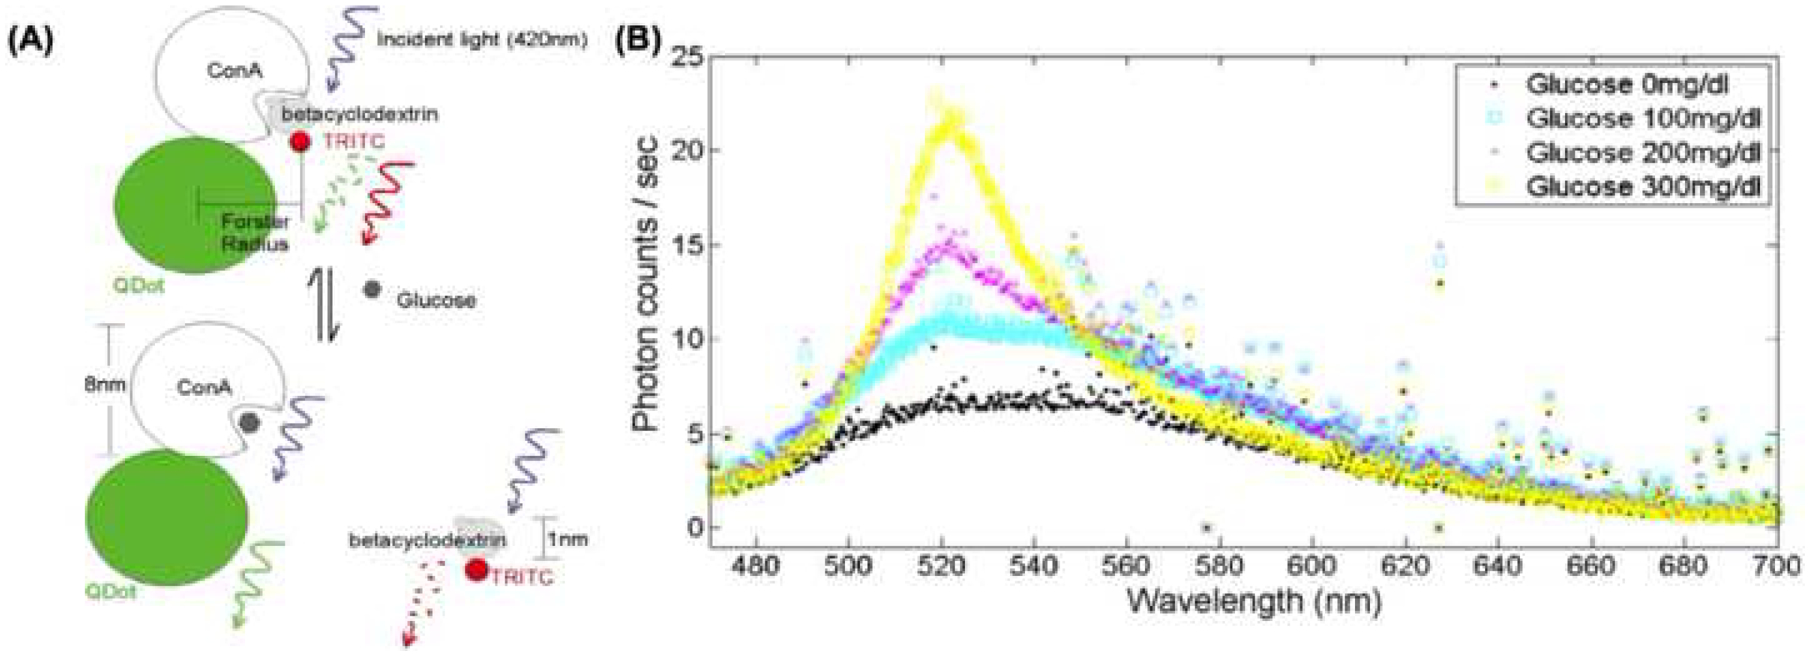
(A) Schematic diagram depicting the concept of QD coupling with ConA, and associated changes in fluorescence wavelength depending on the competitive binding between glucose and betacyclodextrin. The concentration of glucose can be extracted from the ratio between signals from the tetramethylrhodamine isothiocyanate (TRITC) fluorophore and QDs (adapted from Figure 2, reference 51). (B) Results from the optical sensor showing the readout for different concentrations of glucose (adapted from Figure 4, reference 51).