. 2021 Mar 23;10:e63838. doi: 10.7554/eLife.63838

Figure 1. Malaria triggers emergency myelopoiesis and obliterates tissue-resident macrophages.

(A) C57Bl/6 mice were infected with Plasmodium chabaudi AJ or AS sporozoites; the blood-stage of infection started 2 days later after the release of merozoites from the liver. Mice were chronically infected for 40 days, at which point we administered the antimalarial drug chloroquine. Memory responses were assessed 30 days thereafter. Note that we exclusively use days post infection (p.i.) to refer to the blood-stage of malaria. (B) Acute parasitaemia was monitored daily using Giemsa stained thin blood films and chronic infection was verified 40 days p.i. by qPCR (n = 20 per group). Symbols below the limit of detection (5 parasites*μl−1) are coloured grey and these mice were excluded from the study. (C) The mean number of erythrocytes*ml−1 is shown before (grey symbols) and during infection (n = 10 for AJ and n = 14 for AS). Severe anaemia is defined as >50% loss of red cells. (D and E) Inflammatory monocytes and progenitor cells (granulocyte monocyte progenitors [GMP] and megakaryocyte erythroid progenitors [MEP]) from uninfected mice (0 days p.i.), AJ-infected mice (5, 7, 11, and 40 days p.i.) and once-infected mice (memory, 70 days p.i.) were analysed by flow cytometry (n = 4–5 per time point, box-plots show median and IQR). Uninfected age-matched controls were analysed at each time point and pooled for graphing (n = 10); absolute counts are shown for blood and spleen. In (D), GMP are shown as a ratio of infected:uninfected at each time point because bone marrow cellularity increases with age. (F) Paraffin-embedded spleen sections were H&E stained (11 days p.i. for acute AJ infection) – examples of malaria pigment in chronically infected and once-infected mice are marked with an asterisk. (G) Tissue-resident macrophages (Mɸ) and patrolling monocytes from uninfected mice, AJ-infected mice, and once-infected mice were analysed by flow cytometry (n = 4–5 per time point, box-plots show median and IQR). Absolute counts (blood and spleen) and cell ratios (bone marrow) are shown exactly as described for (D and E). See Supplementary file 1 for all antibody panels and gating strategies.

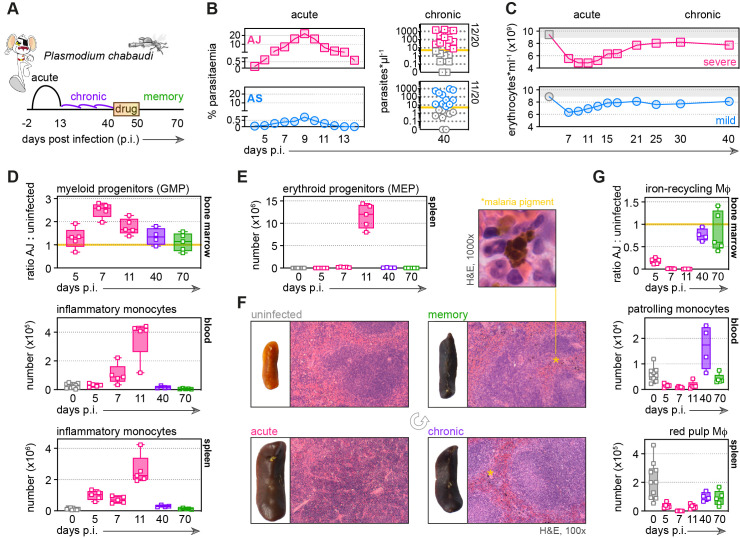
Figure 1.

Figure 1—figure supplement 1. P. chabaudi AJ causes severe disease without sequestering in host tissues.

Figure 1—figure supplement 1.

(A–C) C57Bl/6 mice were infected with P. chabaudi AJ sporozoites; the blood-stage of infection started 2 days later after the release of merozoites from the liver. We refer to the emergence of parasites from the liver as the start of blood cycle 1, after which parasites undergo schizogony approximately every 24 hr to start the next blood cycle. Mice were housed under reverse light conditions (lights OFF 07:00, lights ON 19:00 GMT) so that schizogony would peak at 13:00 GMT. (A) Core body temperature was measured every 2 hr (09:00–21:00 GMT) as parasites transitioned from blood cycle 9 to 10 and again from blood cycle 10 to 11 (n = 20, mean + SEM). (B and C) Parasitaemia was monitored every 2 hr by Giemsa stained thin blood films (09:00–21:00 GMT) as parasites transitioned from blood cycle 6 to 7 (n = 9, mean + SEM). The percentage of infected red cells is shown in (B), whereas the proportion of parasites at the ring, trophozoite, and schizont stages is shown in (C). Note that hypothermia is most severe after the peak of schizogony when all schizonts have ruptured. (D) C57Bl/6 mice were infected with mosquito-transmitted blood-stage parasites (P. chabaudi AS or AJ). Circulating parasitaemia was measured at the peak of schizogony (13:00 GMT) as parasites transitioned from blood cycle 6 to 7 (n = 3 per group, mean + SEM). At the same time, mice were euthanised and organs were fixed in neutral buffered formalin for histology. Sequestration rates in each organ were assessed by counting the percentage of infected red cells inside blood vessels and normalising this number to circulating parasitaemia (see Materials and methods). For high-resolution images and a guide to identifying infected red cells on tissue sections, you can refer to our publication on the sequestration and histopathology of P. chabaudi (Brugat et al., 2014).

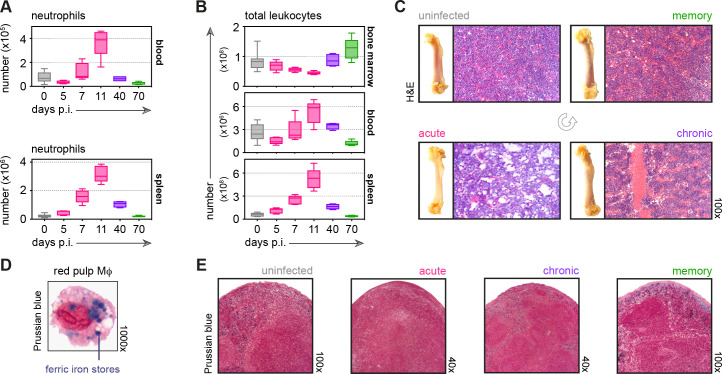
Figure 1—figure supplement 2. Malaria causes major disturbances in tissue structure and integrity.

Figure 1—figure supplement 2.

(A and B) Neutrophils (A) and total leukocytes (B) from uninfected mice (0 days p.i.), AJ-infected mice (5, 7, 11, and 40 days p.i.) and once-infected mice (memory, 70 days p.i.) were analysed by flow cytometry (n = 4–5 per time point, box-plots show median and IQR). Uninfected age-matched controls were analysed at each time point and pooled for graphing (n = 10). (C) Paraffin-embedded femur sections were H&E stained (11 days p.i. for acute AJ infection) – note that during acute infection bones appear translucent, as cellularity drops. (D) Red pulp macrophages (Mɸ) were flow-sorted from uninfected control mice and stained with Prussian Blue (intracellular ferric iron stores) and Neutral Red (nuclei). (E) Paraffin-embedded spleen sections were stained with Prussian Blue and Neutral Red (11 days p.i. for acute AJ infection). See Supplementary file 1 for all antibody panels and gating strategies.