. 2021 Mar 23;10:e62389. doi: 10.7554/eLife.62389

Figure 3. Microcrystals for serial femtosecond crystallography (SFX) experiment and C1C2 SFX structure.

(a) Lipidic cubic phase (LCP) crystals of C1C2 optimized for the time-resolved SFX (TR-SFX) experiments. The orange scale bar on the lower right indicates 50 μm, with 5 μm sub-scaling lines. The size of the crystals ranged from 2 to 5 μm. (b) A diffraction image from a C1C2 crystal, obtained with a single SACLA-XFEL pulse. (c) The structure of dark state C1C2 determined by serial femtosecond crystallography. A water accessible cavity is illustrated, with the putative ion pathway indicated by an arrow. The five glutamic acid residues lining the ion pore (E1–5) and the two counterion residues (Ci1 and Ci2) are indicated by sticks, and the three constriction sites, the inner, central, and outer gates, are enclosed in boxes. (d) Comparisons of the constriction sites of the TR-SFX structure (left panels) and the synchrotron structure (right panels; PDB code 3UG9) of C1C2, for the inner (upper panels), central (middle panels), and outer (lower panels) gates. The constituent residues are shown as sticks, and the TM helix number is indicated on each helix.

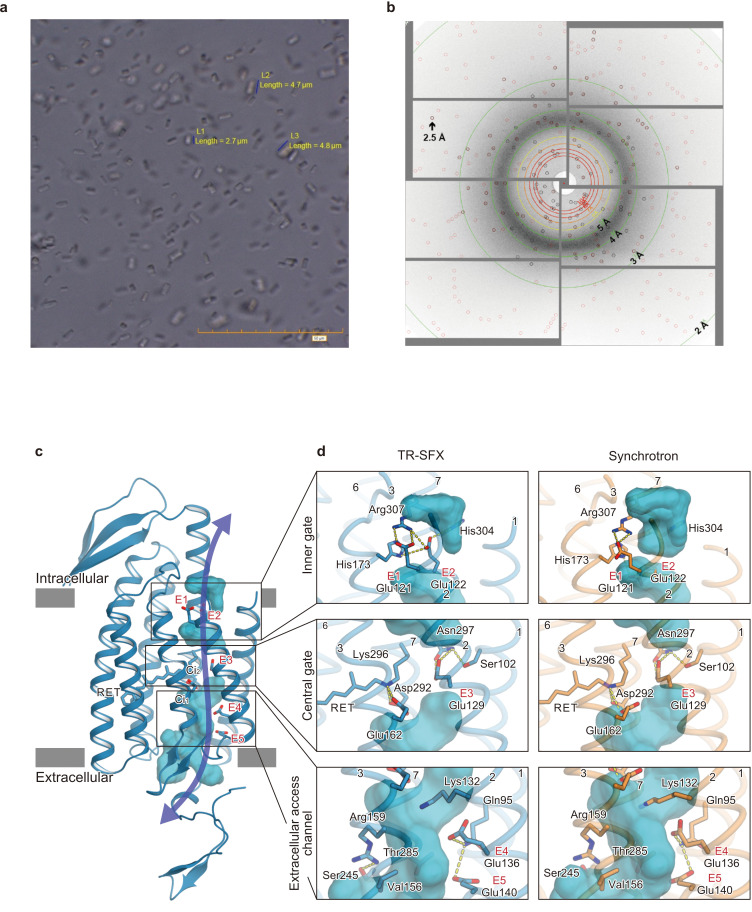
Figure 3.

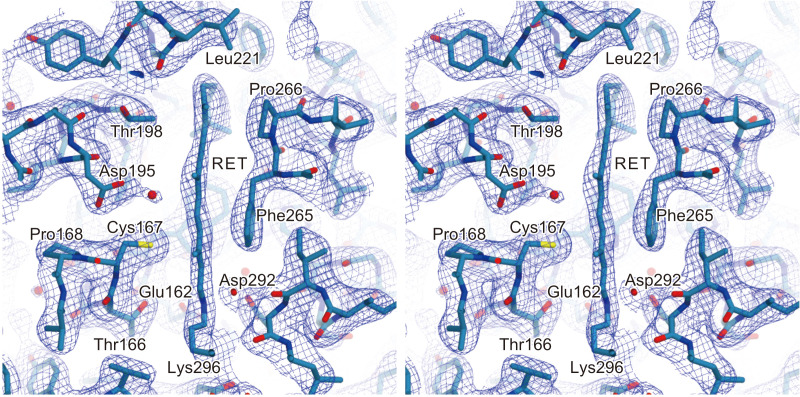
Figure 3—figure supplement 1. Electron density of retinal.

Figure 3—figure supplement 1.

A stereo view of the 2FoFc electron density map for the retinal binding pocket, shown as a mesh representation contoured at 0.9σ. The all-trans retinal and the surrounding residues are indicated by sticks. The red spheres indicate water molecules.
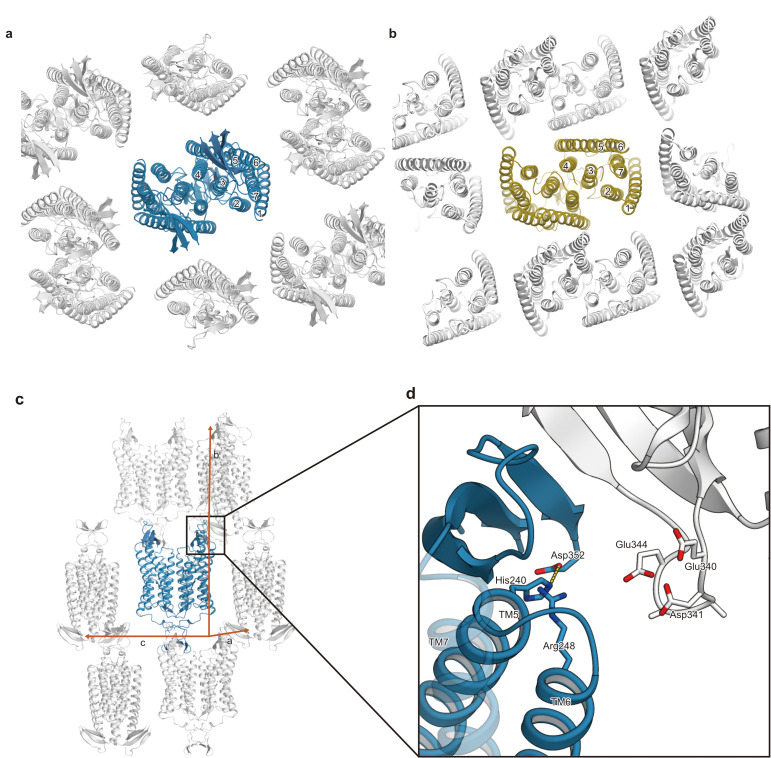
Figure 3—figure supplement 2. Comparison of the crystal packing between C1C2 and CrChR2.

Figure 3—figure supplement 2.

(a and b) Comparison of the crystal packing between C1C2 (PDB: 3UG9) (a) and CrChR2 (PDB: 6EID) (b). The crystal packing of C1C2 shows minimal packing interactions, as compared to the CrChR2 crystal packing. (c) The C1C2 molecules in the crystals are shown in ribbons, viewed from within the lipidic cubic phase (LCP) crystal layer. (d) The residues involved in the crystal packing interactions are shown in sticks.
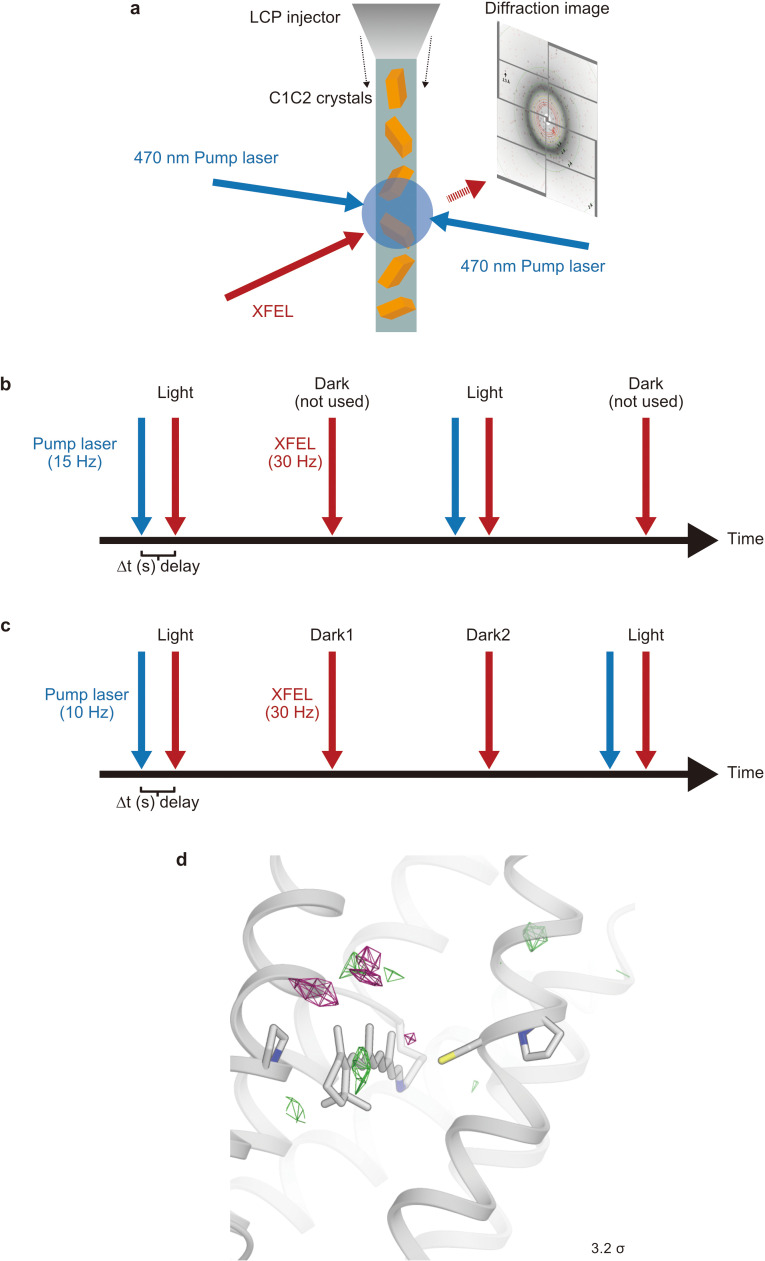
Figure 3—figure supplement 3. Schematic model of the time-resolved serial femtosecond crystallography setup.

Figure 3—figure supplement 3.

(a) The lipidic cubic phase (LCP) microjet continuously transports microcrystals across the focused X-ray free electron laser (XFEL) beam. X-ray diffraction is recorded on a detector for each XFEL exposure. A blue ns laser is used to photo-activate C1C2 microcrystals prior to the arrival of an XFEL pulse. (b and c) Data collection sequence illustrating how X-ray diffraction data were collected at 30 Hz from photoactivated (blue laser flash, 15 Hz [b] and 10 Hz [c], respectively) and resting (no laser flash) phases in an interleaved fashion. Part of the time-resolved serial femtosecond crystallography (TR-SFX) was recorded with a 10 Hz laser flash to check for light-contamination. (d) Fourier difference map of dark2 from the ‘dark’ data set, which was separately collected (Materials and methods).