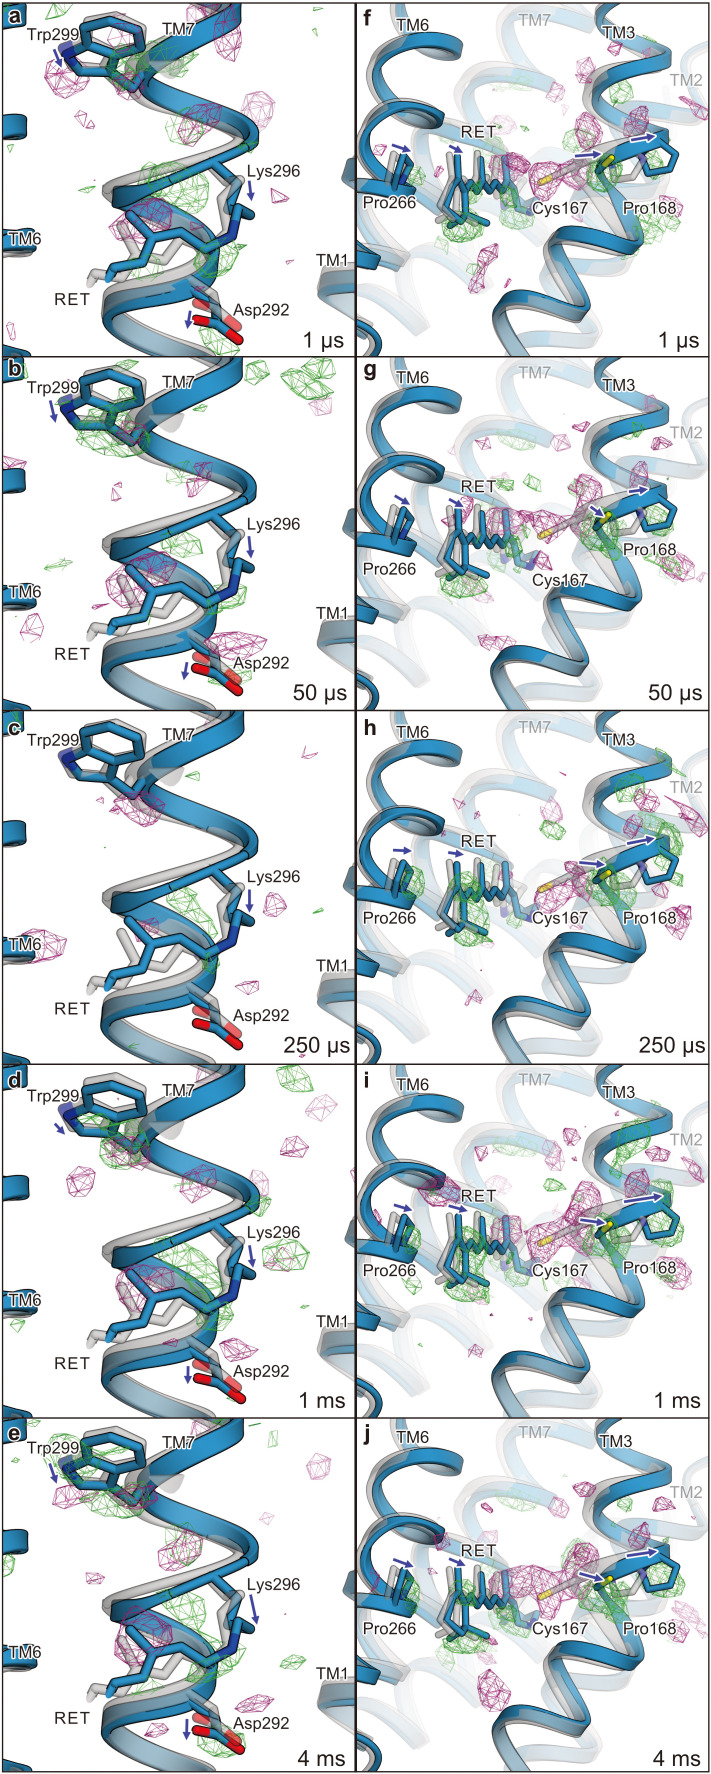
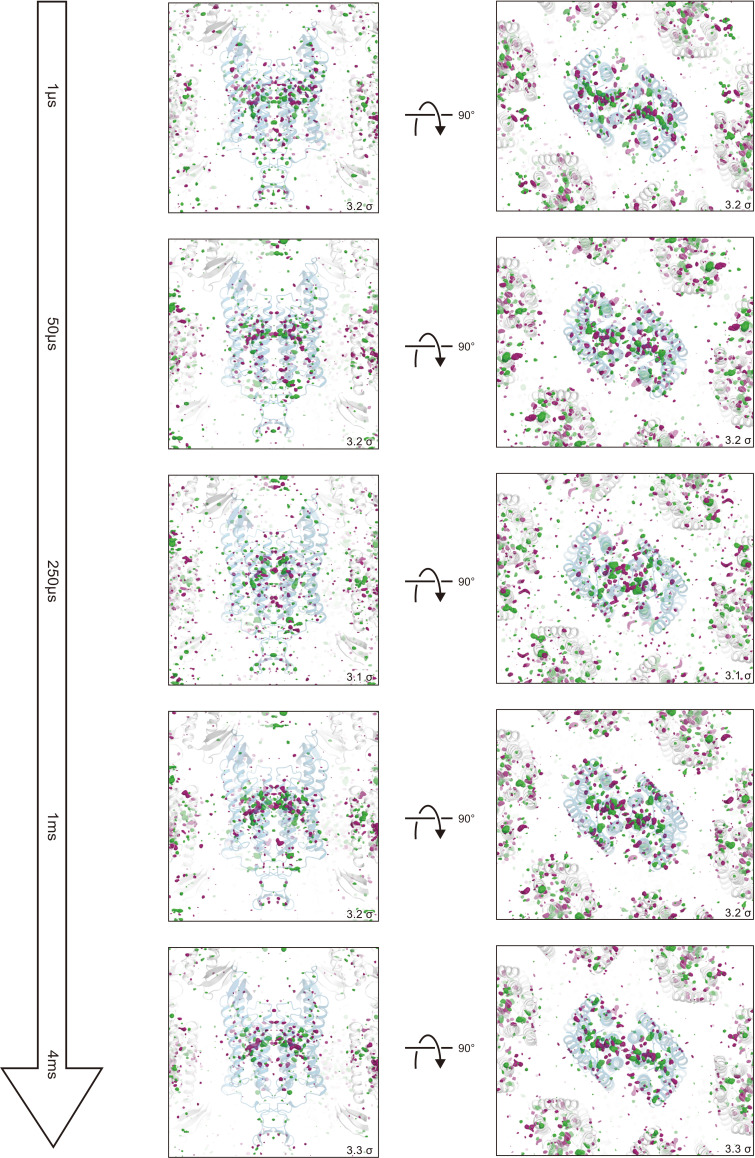
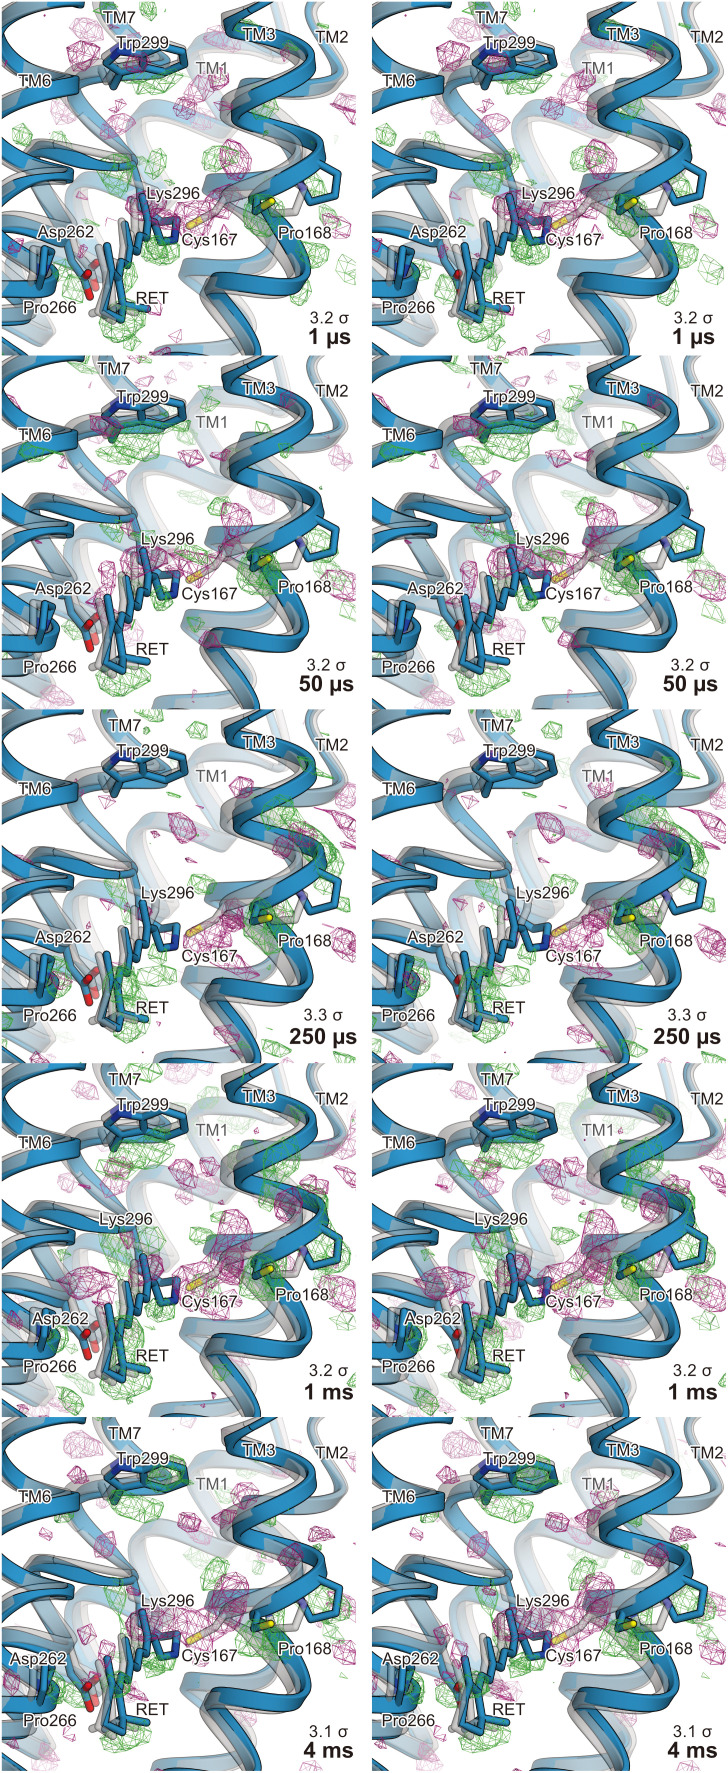
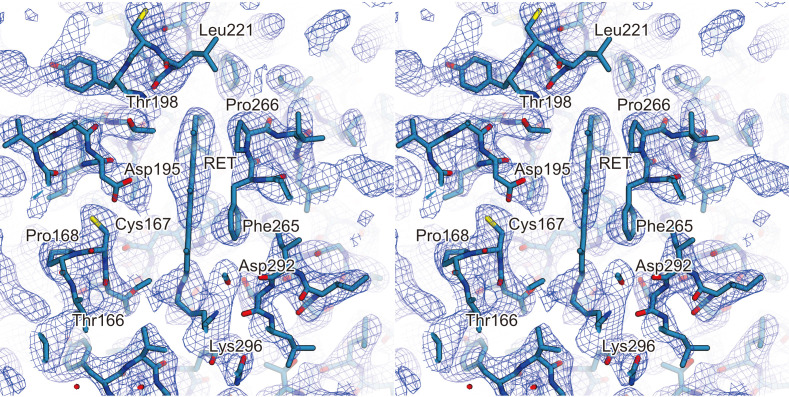
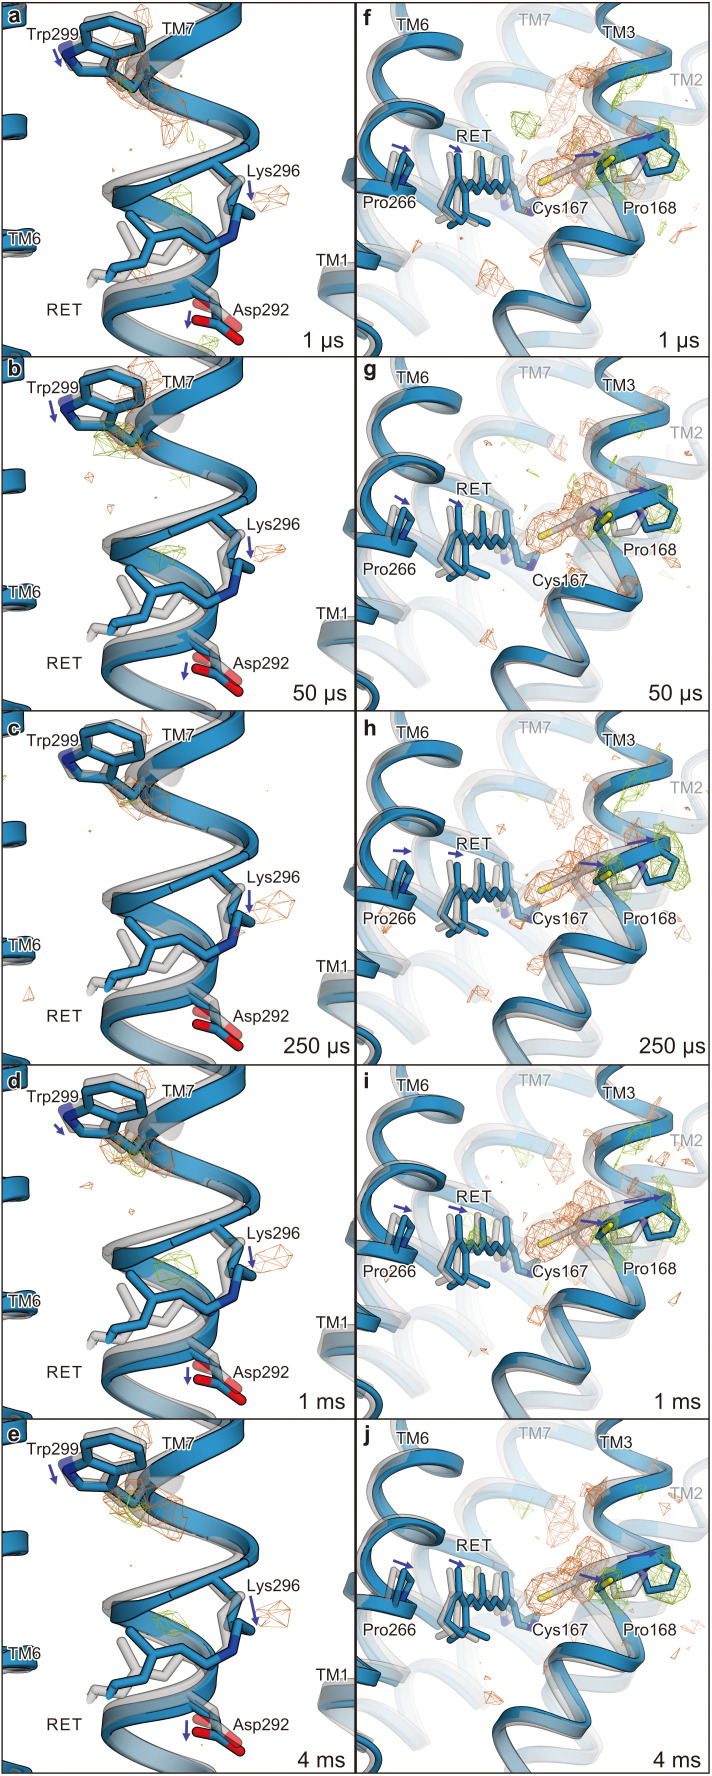
Figure 4. Difference Fourier electron density map and structural changes around TM7 and TM3.
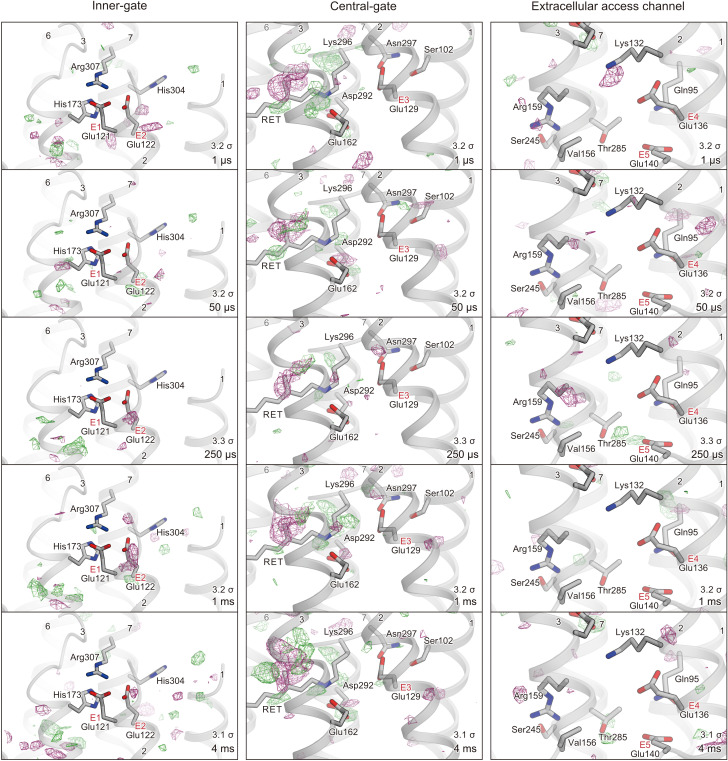
Views of the |Fobs|light− |Fobs|dark difference Fourier electron density maps and the structural changes around TM7 (a–e) and TM3 (f–j) for 1 μs (a and f), 50 μs (b and g), 250 μs (c and h), 1 ms (d and i), and 4 ms (e and j). Green and purple meshes indicate positive and negative difference electron densities, respectively (contoured at ±3.1 to 3.3σ, see also Figure 4—figure supplement 1). The difference Fourier maps were calculated by using the phases from the coordinates of the dark-adapted C1C2 structure (gray). Paired negative and positive difference electron densities indicate the downward shift of TM7 and the outward shift of TM3. The structural model (blue) was refined against the extrapolated data of each time point and the model was superimposed upon the initial-state C1C2 model (gray). Movements of the residues and the TM helices are indicated by arrows. Probably due to the variations in the crystal quality (Table 1), the difference density in the 250 μs time-delay seems rather weak.

