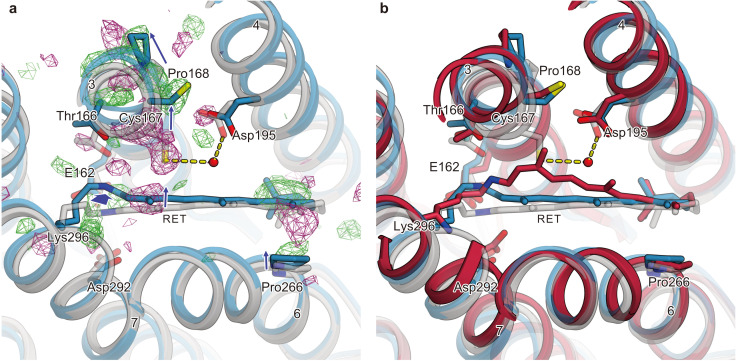
Figure 5. Conformational change of retinal and comparison with QM/MM model.
(a) Intracellular view of the |Fobs|light− |Fobs|dark difference Fourier electron density map and the structural changes around the retinal. Green and purple meshes indicate positive and negative difference electron densities, respectively. The structural model (blue) was refined against the extrapolated data of 1 ms and the model was superimposed upon the initial-state C1C2 model (gray). Movements of residues or TM helices are indicated by arrows. (b) The retinal pocket of dark-adapted C1C2 (gray), the model at the 1 ms delayed-time point (blue), and the model at 400 ns of the QM/MM simulation (Cheng et al., 2018) (red) are superimposed together.

