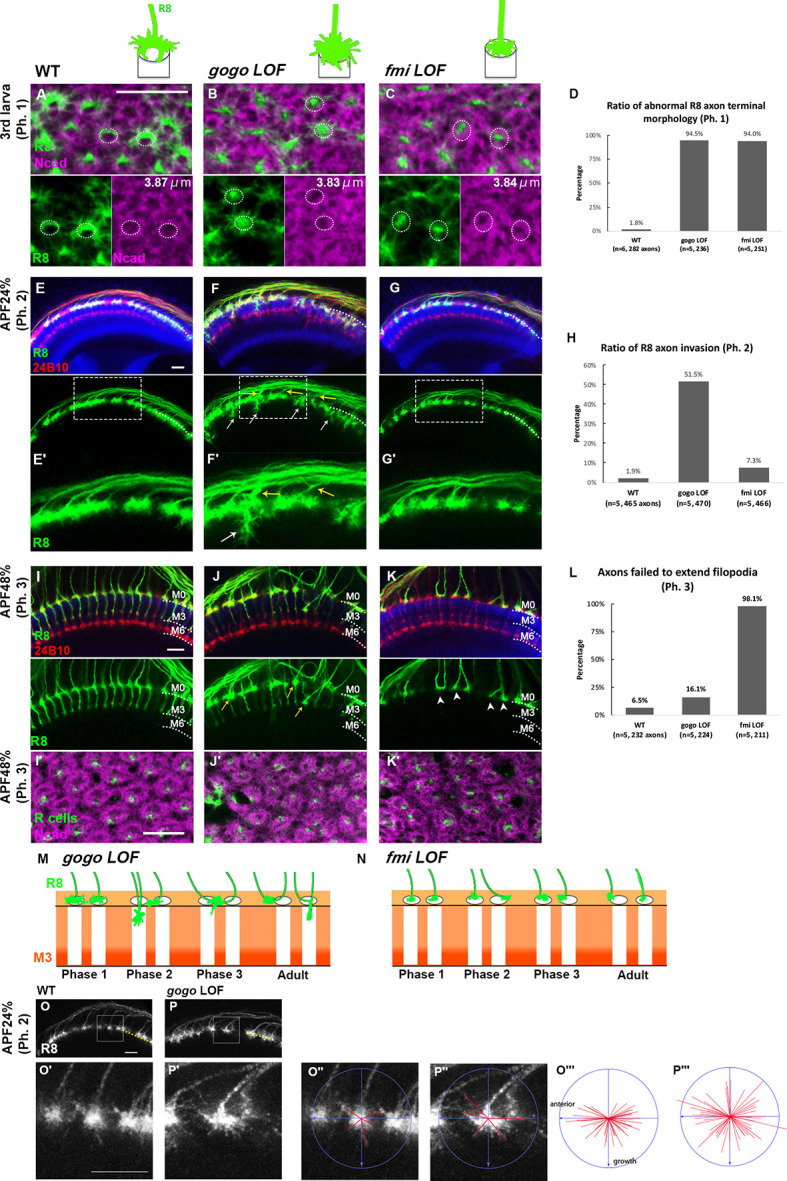
Figure 2. Gogo and Fmi regulates the growth cone dynamic.
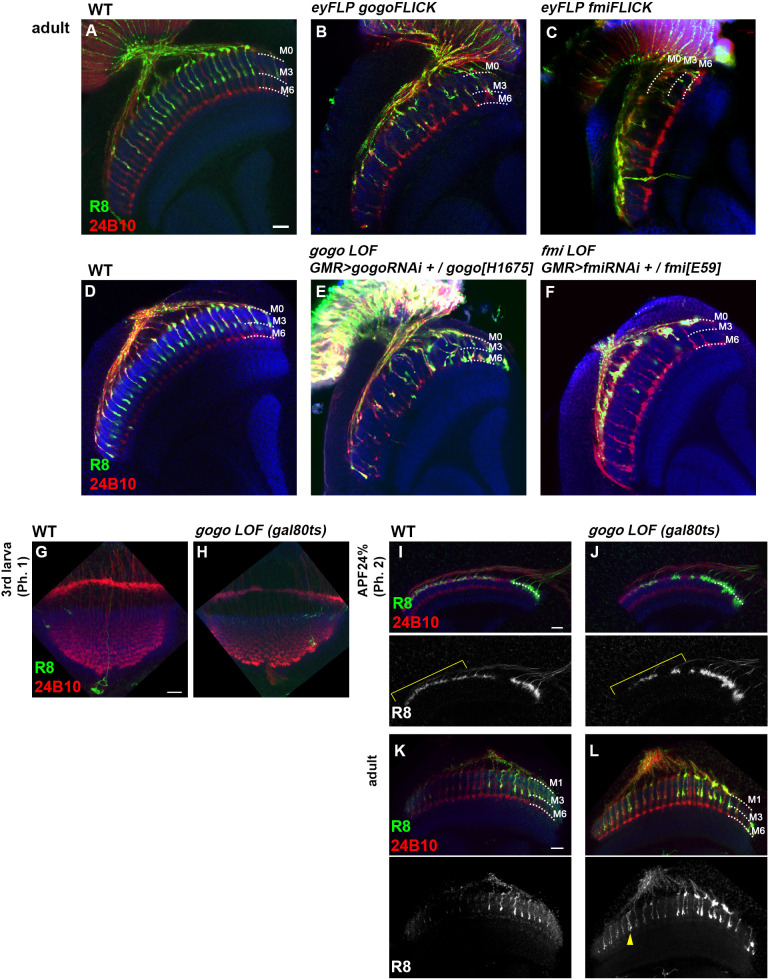
(A–L) The medulla of control, R8-specific gogo loss-of-function mutations, and R8-specific fmi loss-of-function was analyzed. (A–C) The medulla of the third instar larvae (phase 1) was labeled with UAS-mCD8GFP for R8 (green) and anti-N-cadherin (magenta) to visualize columns. The dashed circles demarcate columns. The numbers indicate the average diameter of the medulla columns visualized with anti-N-cadherin (n = 3, 18 columns). (D) Quantification of the R8 axon terminals that intruded into the medulla columnar center and failed to form a proper horseshoe shape during phase 1. (E–G) The medulla at APF24% (phase 2) was labeled with UAS-mCD8GFP for R8 (green), mAb24B10 for all R axons (red) and anti-N-cadherin (blue). gogo loss-of-functions showed R8 axon bundling and overextension beyond the R8 temporary layer (arrows). (H) Quantification of the invasion R8 axons at phase 2. (I–K) The medulla at APF48% (phase 3) was labeled with UAS-mCD8GFP for R8 (green), mAb24B10 for all R axons (red), and anti-N-cadherin (blue). gogo loss-of-function showed R8 axon bundling (arrows), whereas in fmi loss-of-functions, R8 axons failed to extend filopodia vertically toward the M3 layer (arrowheads). (I’–K’) Medulla were labeled with N-cadherin (magenta) and R axons with mAb24B10 (green) to highlight the columnar pattern. (L) Quantification of R8 axons that failed to vertically extend their filopodia toward the M3 layer during phase 3. (M, N) Schematics of R8-targeting phenotype in gogo loss-of-function and fmi loss-of-function in each phase. (O, P). To elucidate the function of Gogo in phase 2, gogo RNAi was expressed in R8 axons in gogo heterozygous mutant only after puparium formation (APF0%) using Gal80ts to eliminate the effect of gogo LOF in phase 1. Since the axons were sparsely labeled using Flp-out system, some axon terminals were isolated and each filopodia can be identifiable (white square in O and P. Enlarged images in O’ and P’). The centers of the growth cones were plotted, and the orientation of axon growth perpendicular to boundary line of medulla was determined. Tips of the five longest filopodia were connected to the center by red lines (O’’, P’’). Fifty lines from ten axons were collected and merged into one image (O’’’, P’’’). In the phase 2-specific gogo LOF, anterior R8 axon growth cones extended longer filopodia in more radial directions than wild type. Scale bars 10 μm.


