. 2021 Mar 5;10:e66718. doi: 10.7554/eLife.66718

Figure 3. Gogo has dual functions, 'cooperative’ and ‘antagonistic’ toward Fmi.

(A–E) R8 axons in wild type (A), R8-specific knockdowns of gogo (B), fmi (C), and gogo, fmi double knockdowns (D) in phase 1 were visualized using R8-specific UAS-mCD8GFP (green) counterstained with anti-N-cadherin (magenta). (E) Quantification of the R8 axon terminals that intruded into the medulla columnar center and failed to form a proper horseshoe shape at phase 1 (third instar larva). (F–L) Genetic interaction between fmi and gogo. R8 axons are labeled with mCD8GFP (green), and counterstained with mAb24B10 (red) and anti-N-cadherin (blue). R8 axons overexpressing gogo failed to extend their filopodia vertically toward the M3 layer (arrowheads in G compared with F). (H) Quantification of R8 axons failed to vertically extend their filopodia toward the M3 layer during phase 3 (APF48%). (I) Upon fmi overexpression, R8 cells extended their vertical filopodia toward the deeper layer of the medulla during phase 2 (APF24%). The vertical filopodia extension was further promoted by gogo RNAi (J) and strongly suppressed by gogo overexpression (K). (L) Quantification of R8 filopodia length. The length of the longest filopodia was measured in 3D images and divided into three classes: <5 μm (light blue), 5–15 μm (dark blue), and >15 μm (magenta). Scale bars 10 μm.
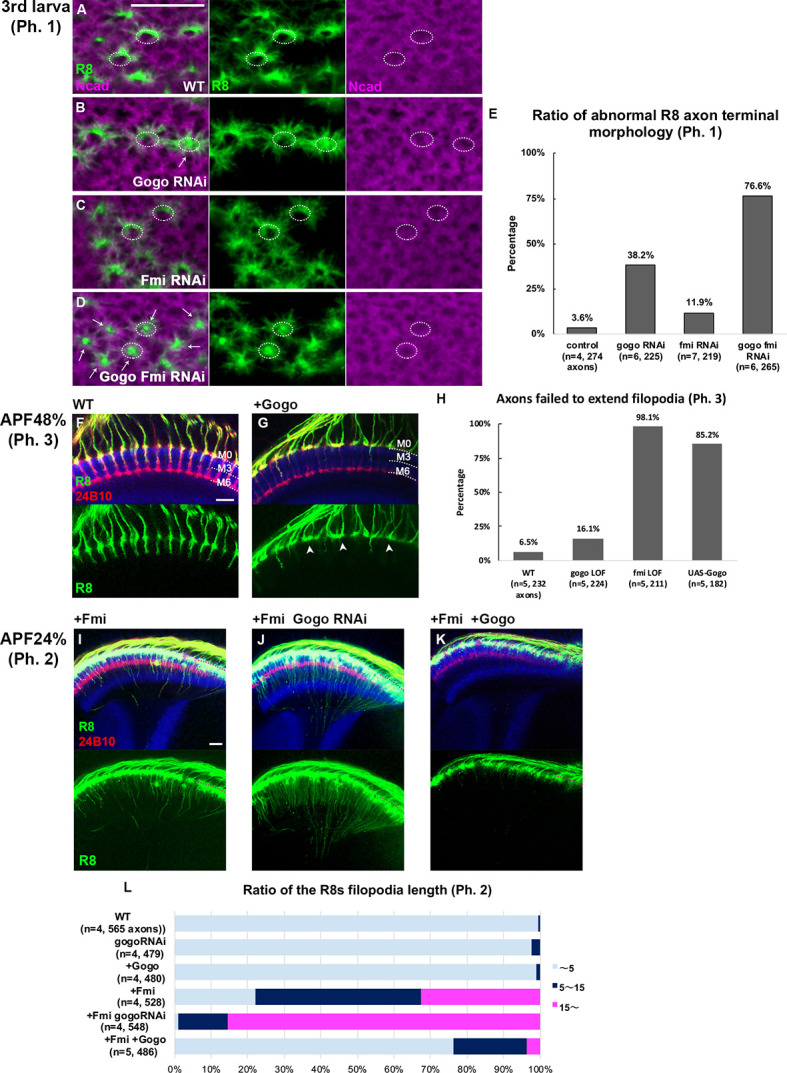
Figure 3—source data 1. Source data for the quantification in Figure 3E.
Figure 3—source data 2. Source data for the quantification in Figure 3H.
Figure 3—source data 3. Source data for the quantification in Figure 3L.
elife-66718-fig3-data3.xlsx (184.4KB, xlsx)

Figure 3.

Figure 3—figure supplement 1. Gogo and Fmi functions are not redundant.

Figure 3—figure supplement 1.

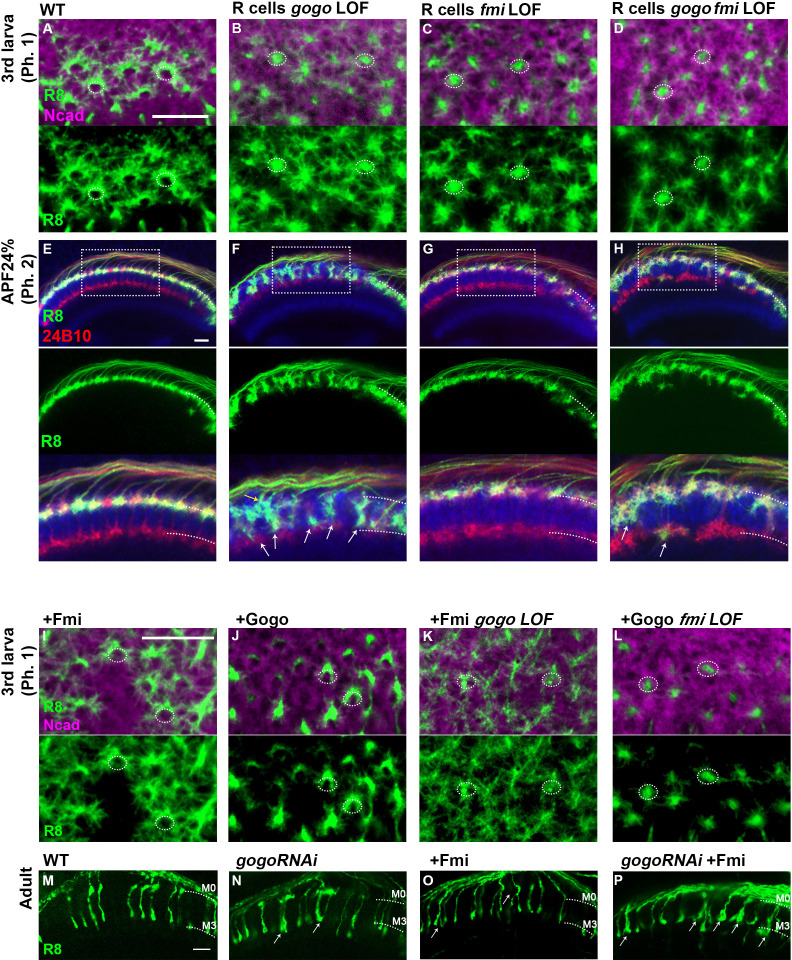
(A–H) R8 axons in medulla at phase 1 (A–D) and phase 2 (E–H) were visualized with GFP (green) counterstained by anti-N-cadherin (magenta in A-D, blue in E-H) and 24B10 (red in E-H) in control (A, E) and R cell-specific loss- of-function of gogo (B, F), fmi (C, G), and gogo, fmi double (D, H). Compared to the gogo single LOF mutant, gogo/fmi double LOF mutants showed much milder bundling and invasion defects in phase 2 (arrows). (I–L) Mutual rescue between gogo and fmi was tested during phase 1 (third larva). R8-specific gogo or fmi loss-of-function clones were generated by heterozygote mutation with R8-specific RNAi. R8-specific expression of Gogo or Fmi was driven by the sensFLP, GMR-FsF-Gal4. R8 axons were visualized with mCD8GFP (green), and counterstained with anti-N-cadherin (magenta). Expression of Gogo or Fmi in the loss-of-function of the other gene did not show any functional rescue (K–L). (M–P) The expression of Gogo was downregulated using RNAi in the Fmi overexpression background. The gogo RNAi and fmi transgeneswere expressed by sensFLP; GMR-FsF-Gal4 driver. R8 axons were labeled with UAS-mCD8GFP (green). In wild type (M), R8 axons do not bundle each other and target M3 layer. In gogo knockdown (N) or Fmi overexpression (O), few bundling of the R8 axons (arrows in N-O) was found in the adult stage, and the phenotype was enhanced by combining them (arrows in P). Scale bars 10 μm.
Figure 3—figure supplement 2. Functional domain analysis of Gogo.

Figure 3—figure supplement 2.

(A–H) Small deletions as illustrated above each image heterozygous with gogo null mutation were analyzed at phase 1. R8 axons were labeled with myr-Tomato (green) counterstained with anti-N-cadherin (magenta). Small deletions of GOGO (C–F) or Tsp1 (H) domains resulted in the R8 axons targeting defects equivalent to gogo null mutant (B). (I–O) The transgenes as illustrated above each image were expressed in all photoreceptor neurons by GMR promoter in the background of R8-specific Fmi overexpression. R8 axons were labeled with mCD8GFP (green) in Fmi overexpression at phase 2 (APF24%). Gogo which lacks GOGO domain (K and N) or Tsp1 domain (L) showed weaker suppression of filopodia extension phenotype in Fmi overexpression than wild type Gogo (J). (O) Quantification of R8 axon filopodia length. The length of filopodia was divided into three classes: ~5 μm (light blue), 5–15 μm (dark blue), 15 μm ~ (magenta). Scale bars 10 μm.
Figure 3—figure supplement 2—source data 1. Source data for the quantification in Figure 3—figure supplement 2O.