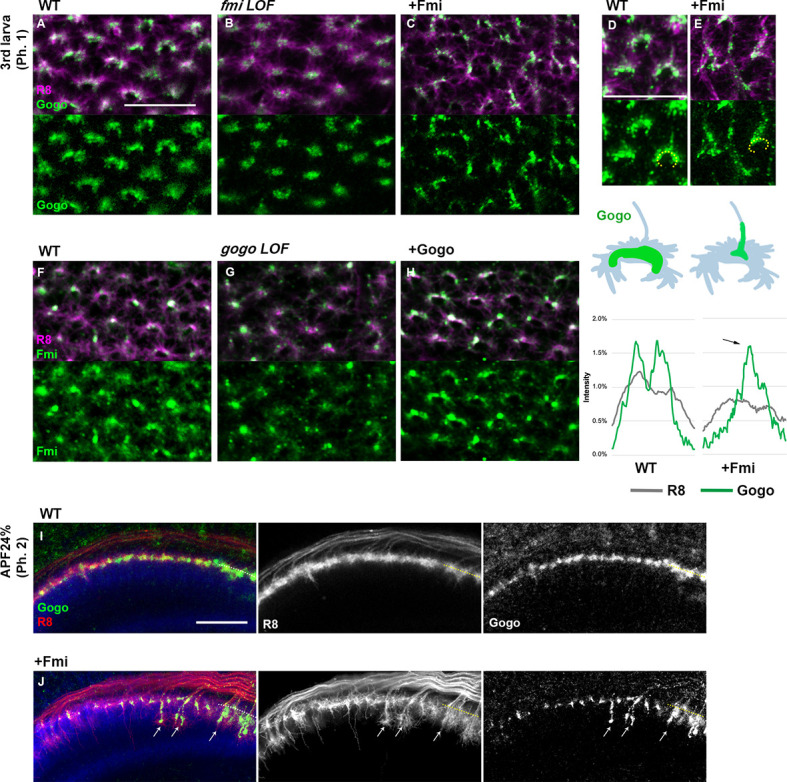
Figure 4. Gogo localization in R8 changes depending on the expression level of Fmi.

(A–H) Localization of R8-specific Gogo-GFP (A–E) and Fmi-mCherry (D–H) in loss-of-function (heterozygous mutation with R8-specific RNAi) or overexpression backgrounds. R8 axons were labeled with myr-RFP or mCD8GFP. (D–E) 3D images of Gogo localization in R8 cells of wild type (D) or Fmi overexpression (E). The fluorescent intensity of Gogo-GFP (green) and R8 myr-RFP (gray) was measured along the horseshoe structures (the dotted lines in D, E) and the average of four axons (n = 2 animals) is shown in the graph below each image. Upon Fmi overexpression, strong Gogo expression was observed at the stalk of the axon terminal (C and E compared with A and D, arrow in the histogram of +Fmi). (F–H) Fmi localization did not show remarkable change in gogo loss-of-function (G) nor in gogo overexpression (H) mutants compared with the wild type (F). (I, J) R8-specific Gogo-GFP (green) during phase 2 in wild type (I) and Fmi overexpression mutants (J). R8 axons are labeled with myr-RFP (red) and counterstained with anti-N-cadherin (blue). Gogo protein was localized along the vertical filopodia that prematurely extended during phase 2 (arrows in J compared with I). Scale bars 10 μm.
