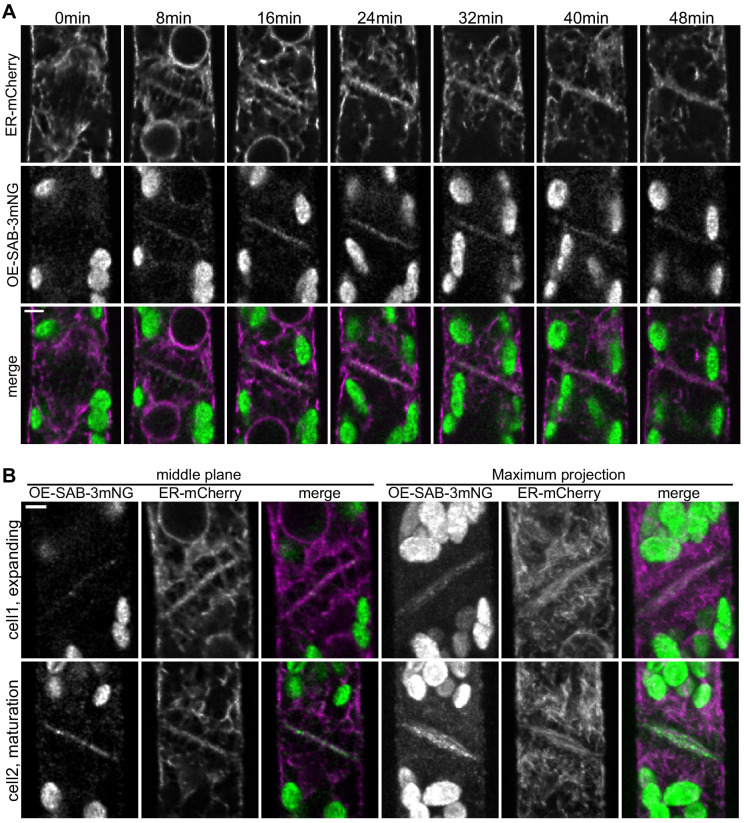
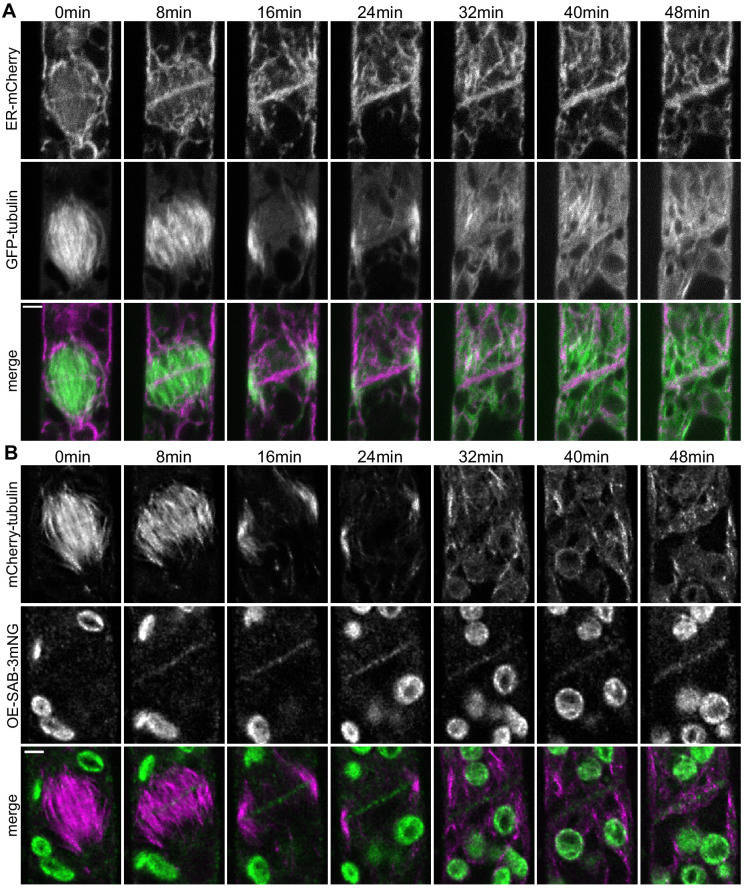
Figure 5. SABRE and endoplasmic reticulum (ER) accumulate on the nascent cell plate during cell plate maturation.
(A) Deconvolved confocal images of OE-SAB-3mNG (green in merge) and mCherry-tubulin (magenta in merge) during cell division. Individual frames are medial focal planes of the cell. Scale bar, 3 µm. Also see Video 7. (B) Two representative cells with ER-mCherry (magenta in merge) and OE-SAB-3mNG (green in merge) showing the difference in the accumulation of SABRE and ER during cell plate expansion and maturation. Scale bar, 3 µm.


