. 2021 Mar 9;10:e65166. doi: 10.7554/eLife.65166

Figure 7. Behavior of endoplasmic reticulum (ER), actin, and microtubules during cytokinesis failures in ∆sabre.

Single focal planes from confocal images of (A) ER labeled with SP-GFP-KDEL, maximum projection of confocal Z-stacks of (B) actin labeled with Lifeact-GFP, and (C) microtubules labeled with GFP-tubulin in wild type and ∆sabre cells that accumulate brown material during cell division. (A) Between 0 and 20 min, a phragmoplast formed. At 30 min, the ∆sabre phragmoplast failed to mature and brown material deposition gradually occurred over the following hours. Scale bar, 6 µm. (B) Scale bar, 5 µm. (C) Scale bar, 10 µm. Also see Video 12.

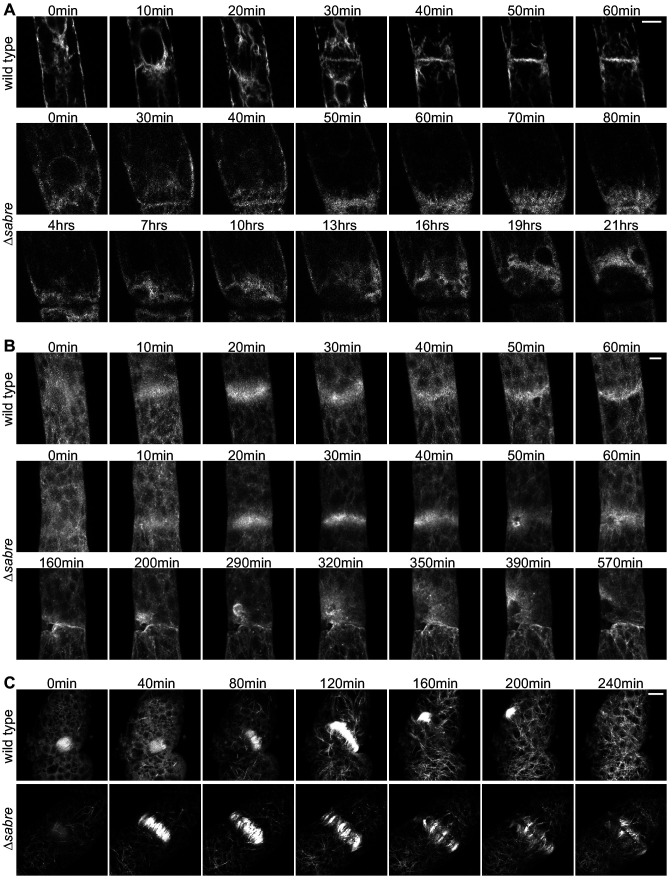
Figure 7.

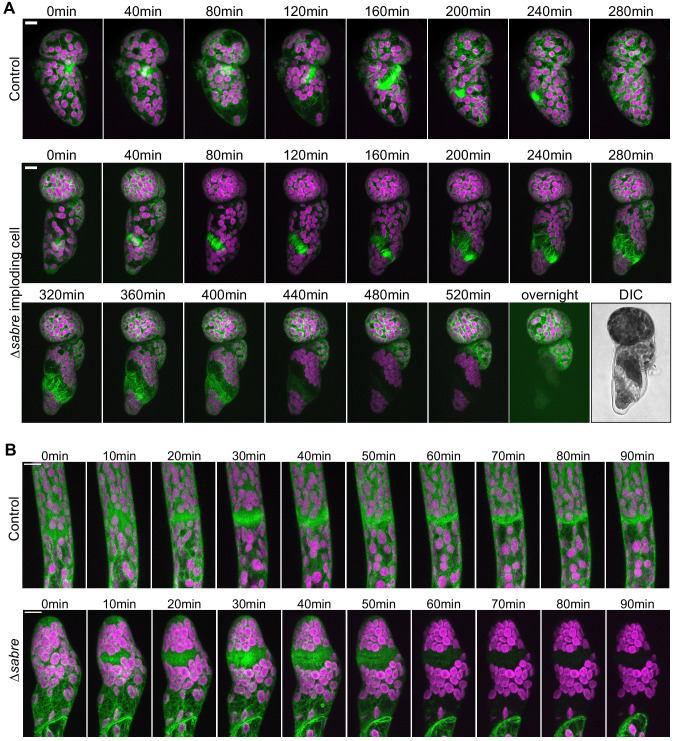
Figure 7—figure supplement 1. Phragmoplast microtubule and actin behavior during cytokinesis failures in ∆sabre that resulted in cell lysis during cell division with no brown material deposition.

Figure 7—figure supplement 1.

(A) Time-lapse imaging of GFP-tubulin (green) and chlorophyll autofluorescence (magenta) in 4-day-old plants regenerated from protoplasts. Images are maximum projections of confocal Z-stacks. Top: a control cell dividing successfully. Bottom: a ∆sabre cell exhibiting phragmoplast microtubule disorganization and rapid cell lysis. Differential interference contrast image in (B) depicts the dead cell at the end of the movie. Scale bars, 10 µm. (B) Actin labeled with Lifeact-GFP (green) and chlorophyll autofluorescence (magenta) during cell division. Scale bars, 10 µm. Top: a control cell dividing successfully. Bottom: a ∆sabre cell that lysed during cell plate formation.