
Author response image 3. Lapwise similarity of population activity during locomotion with individual network events.
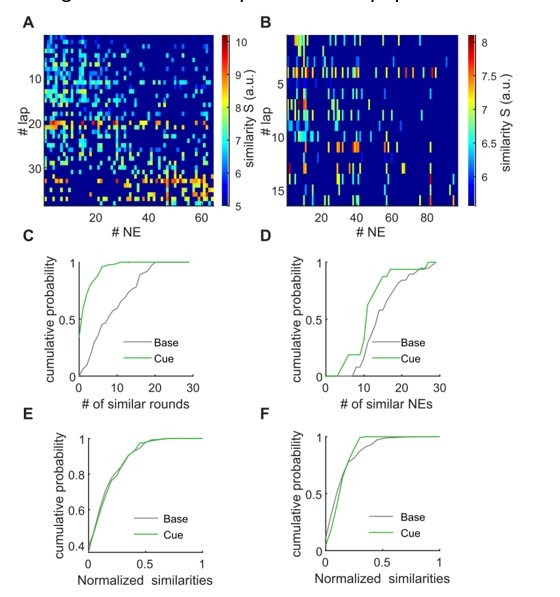
A, B, The matrix shows similarity values for the PCA-based comparison between population activity during all network events (x-axis), and during all individual laps. Nonsignificant comparisons are dark blue. A: Baseline example, B: cue-enriched example. C, D, Quantification of the amount of similarity. Panel C shows for individual network events to how many lapwise activity patterns the similarity is higher than chance. Panel D shows for individual lapwise activities to how many network events it is similar. Plots in C, D correspond to data shown in A, B. E, F, as in C, D, but x-axis normalized and averaged (n = 9 mice, 1 session per condition).