Figure 2.
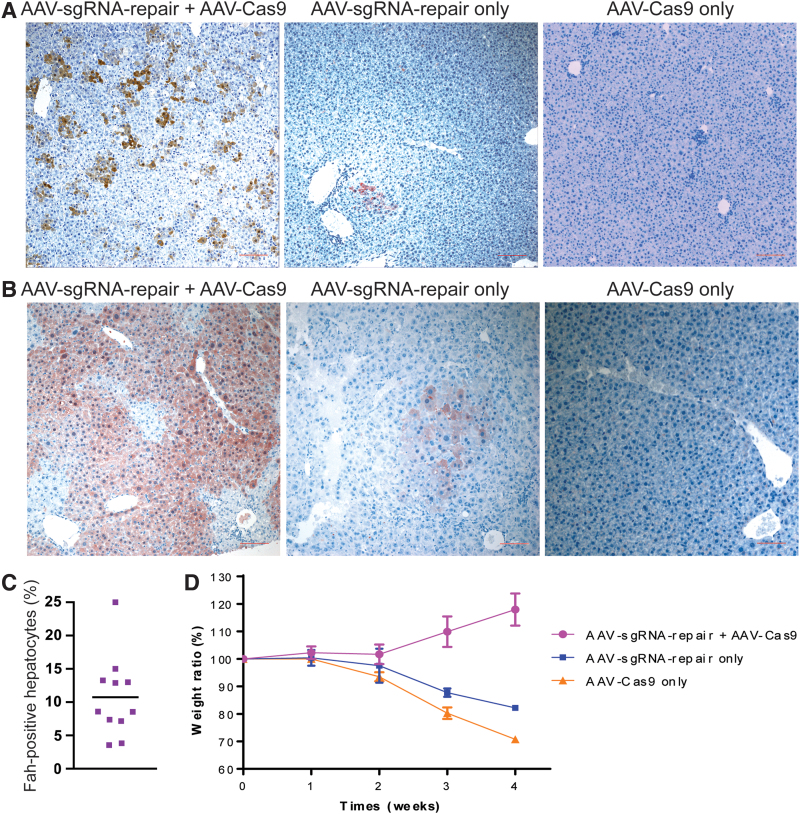
Gene correction in neonatal Fah−/− mice. (A) Liver immunohistochemistry. Top panels: Representative pictures of Fah staining without NTBC selection. The scale bar (100 μm) is shown in red. (B) Representative pictures for Fah staining after NTBC withdrawal and selection of Fah+ hepatocytes. NTBC was removed from the drinking water 4 weeks after the initial AAV administration and harvested 4 weeks later. (C) Statistical quantification of the gene correction frequency in hepatocytes. The data are pooled results (n = 11 overall) from multiple experiments. (D) Weight curves after NTBC withdrawal. Data are presented as mean ± SEM (n = 5 for the dual virus group, n = 3 each for either one of the two control groups receiving only one virus). NTBC, 2-(2-nitro-4-trifluoromethylbenzoyl)-1,3-cyclohexanedione; SEM, standard error of the mean. Color images are available online.

