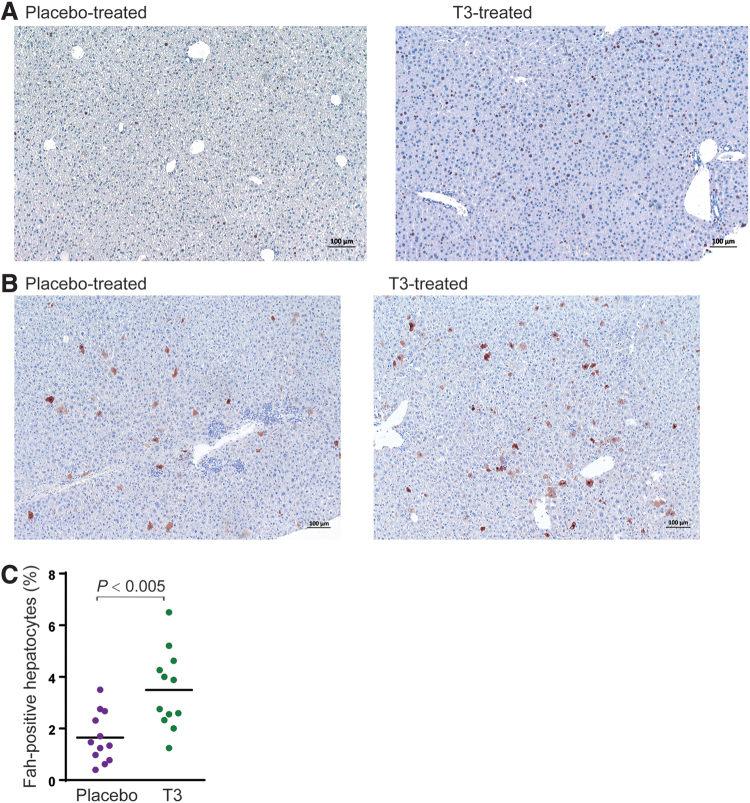
Figure 4.
Gene correction with induced liver regeneration. (A) Liver immunohistochemistry. Representative pictures for BrdU staining (brown). The labeling index was significantly increased in animals treated with the T3 diet. The black scale bar denotes 100 μm. (B) Fah staining (brown) of T3-treated and placebo-treated adult Fah−/− mice. Eight-week-old adult mice were used for the AAV injection and monitored for 4 more weeks before harvesting livers for Fah staining. (C) Quantification of the gene correction frequency in hepatocytes. The data are pooled results (n = 12 for each group) from multiple experiments. BrdU, 5-bromo-2′-deoxyuridine. Color images are available online.

