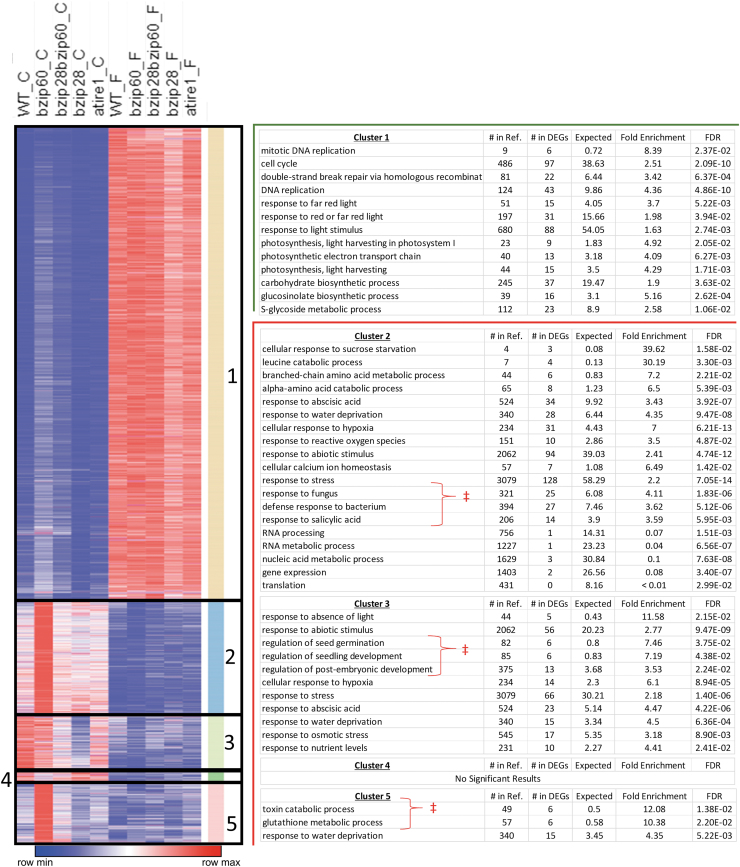
FIG. 6.
K-means clustering analysis of all 3465 DEGs in at least 1 background. Each row represents fragments per kilobase exon model per million mapped reads values of an individual gene averaged between biological replicates. For each row, blue represents the minimum relative expression value, red the maximum expression value, and white is the middle value. For each cluster, GO biological process analysis of DEGs demonstrates a role for UPR regulation of ground control stress responses, which are largely repressed by flight. UPR, unfolded protein response.

