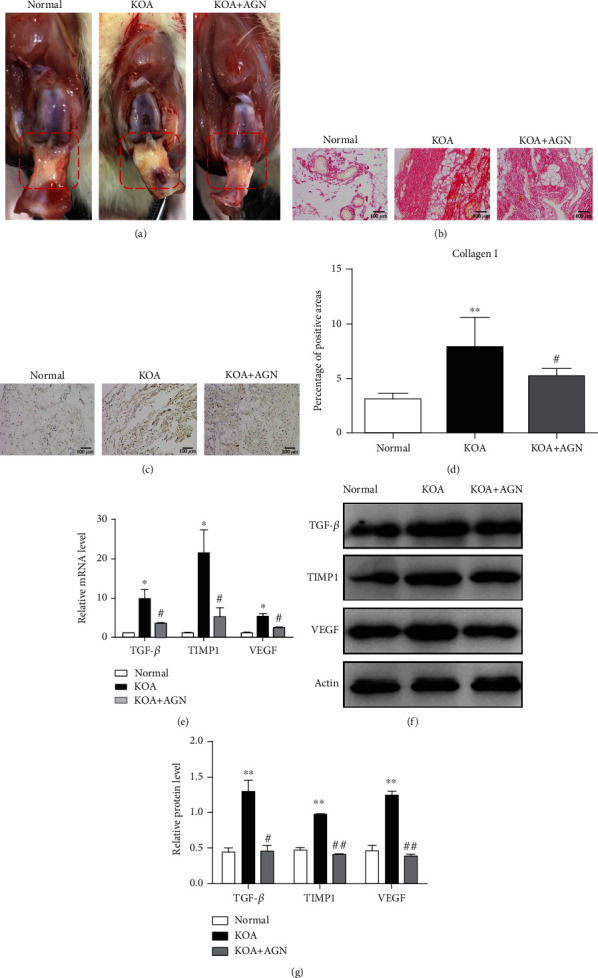
Figure 3.

Agnuside alleviates synovial fibrosis in KOA rats. (a) Anatomical changes of synovial tissues (red box area) in each group. (b) Collagen deposition was revealed through Sirius Red staining, 200x, scale bar = 100 μm. (c) Representative type I collagen immunohistochemical sections of synovial tissues in each group, 200x, scale bar = 100 μm. (d) Semiquantification of immunohistochemical sections was evaluated by calculating the percentage of collagen I-positive areas. ∗∗P < 0.01, in comparison with the normal group. #P < 0.05, in comparison with the KOA group. Data were analyzed by ImageJ. (e) Comparison of TGF-β, TIMP1, and VEGF mRNA levels between groups. ∗P < 0.05, compared with the normal group. #P < 0.05, compared with the KOA group. (f) Typical protein bands for each group. (g) Comparison of TGF-β, TIMP1, and VEGF protein expressions between groups. ∗∗P < 0.01, compared with the normal group. #P < 0.05, ##P < 0.01, compared with the KOA group.
