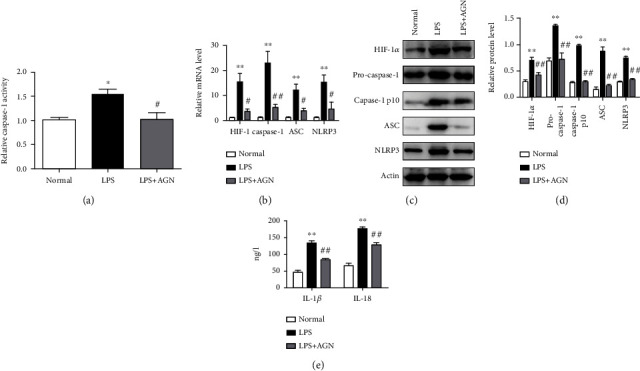
Figure 4.

Agnuside inhibits HIF-1α accumulation and NLRP3 inflammasome activation in LPS-treated FLSs. (a) Relative caspase-1 activity for each group. ∗P < 0.05, in comparison with the normal group. #P < 0.05, in comparison with the LPS group. (b) mRNA level of HIF-1α, caspase-1, ASC, and NLRP3 in each group. ∗P < 0.05, ∗∗P < 0.01, in comparison with the normal group. #P < 0.05, ##P < 0.01, in comparison with the KOA group. (c) Typical protein bands for each group. (d) Protein level comparison of HIF-1α, pro-caspase-1, caspase-1 p10, ASC, and NLRP3 between groups. ∗∗P < 0.01, compared with the normal group. ##P < 0.01, compared with the KOA group. (e) FLS supernatant contents of IL-1β and IL-18 between groups. ∗∗P < 0.01, compared with the normal group. ##P < 0.01, compared with the KOA group.
