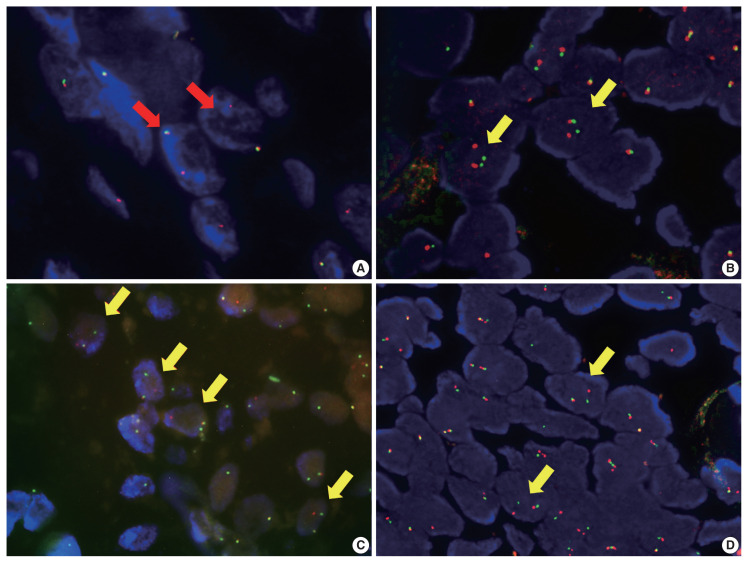
Fig. 3.
Representative image of fluorescence in situ hybridization (FISH) analysis for MAML2 and EWSR1 from case 1 (A, B) and 2 (C, D). (A, B) In case 1, FISH analysis for MAML2 reveal one fused signal and a single red signal (red arrows), suggesting partial deletion or unbalanced translocation of MAML1 (A). (B) EWSR1 shows one fused signal and separate red and green signal (yellow arrows), indicating translocation of EWSR1. (C, D) Case 2 shows several cells with split of red and green signals (yellow arrows) for MAML2 (C) and EWSR1 (D), indicating concurrent MAML1 and EWSR1 rearrangement.

