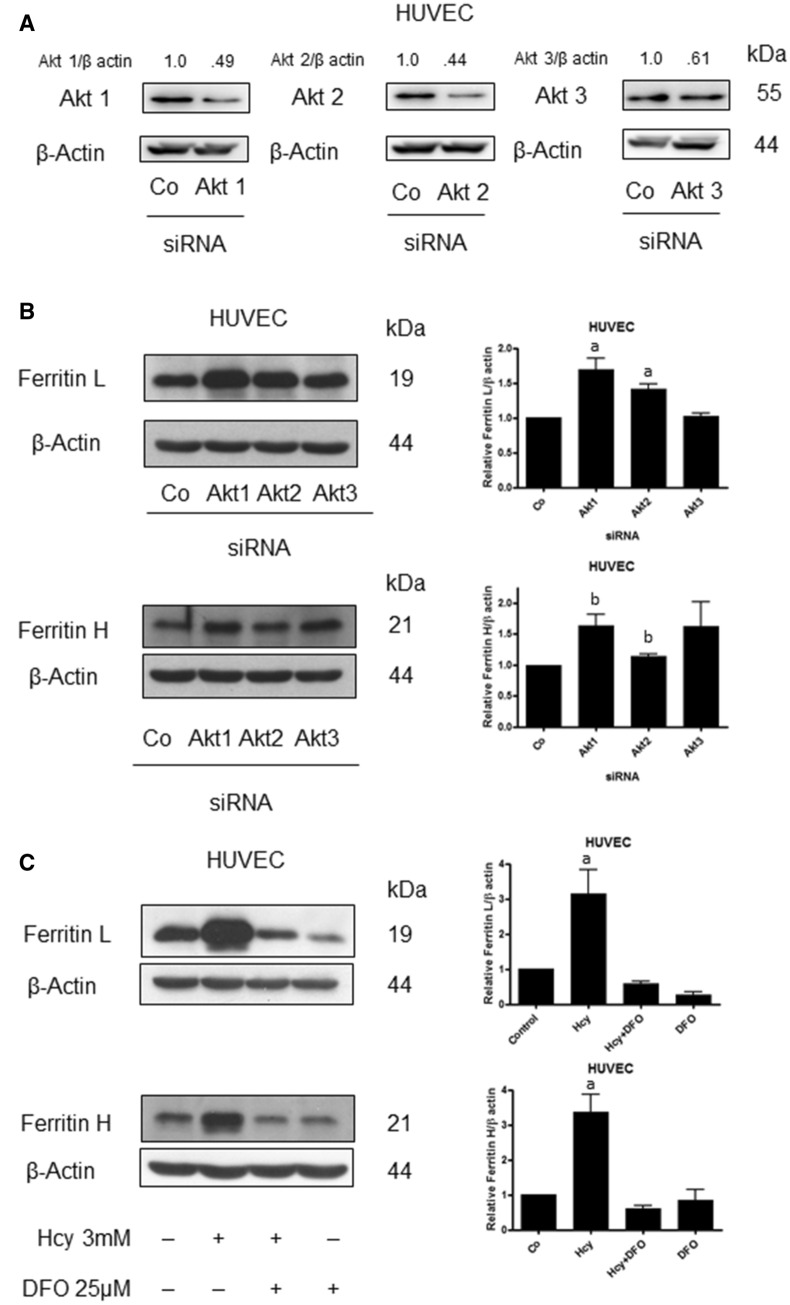
Fig. 3.
Downregulation of Akt leads to a rise in ferritin L and H in HUVEC cells. A Immunoblotting for Akt1, Akt2, Akt3 using lysate of HUVEC cells transfected with siRNA against Akt1, Akt2 and Akt3, respectively. Densitometric scanning data after correction for actin loading control are on top of Akt immunoreactive bands. B Immunoblotting for ferritin L and ferritin H using lysate of HUVEC cells transfected with siRNA against Akt1, Akt2 and Akt3, respectively, Blots were stripped and reprobed with anti-β-actin antibody to normalize for differences in protein loading. Bar graphs on the right panel of the figure present the mean ± SEM of three independent experiments relative to control where: "a" represents statistical significance at p < 0.05 as compared to control (one-way ANOVA followed by Dunnett’s multiple comparison test), "b" represents statistical significance at p < 0.05 as compared to control (t Student test). C Immunoblotting for ferritin L and ferritin H using lysate of HUVEC cells treated for 24 h with 3 mM Hcy with or without a 2 h pretreatment with 25 μM DFO. Blots were stripped and reprobed with anti-β-actin antibody to normalize for differences in protein loading. Bar graphs on the right panel of the figure present the mean ± SEM of three independent experiments relative to control where "a: represents statistical significance at p < 0.05 as compared to control (one-way ANOVA followed by Tukey’s multiple comparison test)

