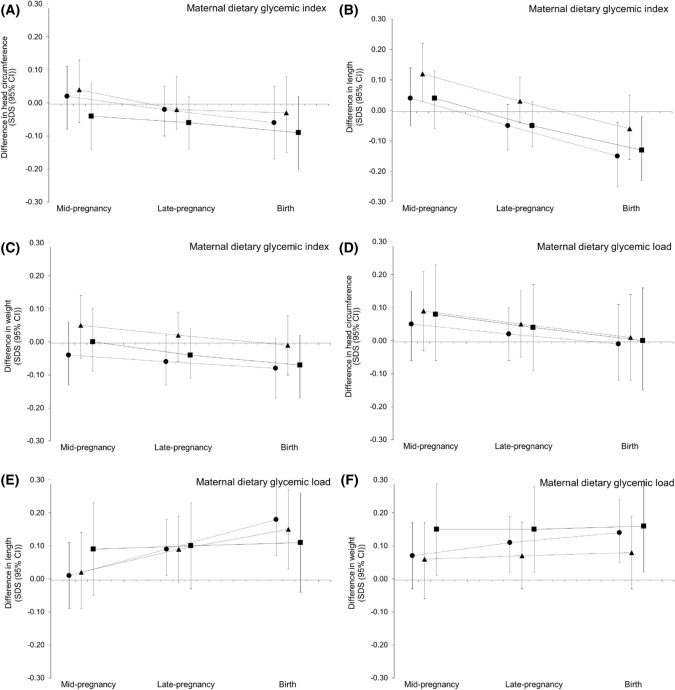
Fig. 1.
Associations of maternal dietary glycemic index and load with fetal growth patterns from mid-pregnancy onwards differences in fetal growth rates for the upper three maternal dietary glycemic index quartiles (a–c) and the upper three maternal dietary glycemic load quartiles(d–f), as compared to the lowest maternal dietary glycemic index and load quartile, respectively. Circles represent the second quartile, triangles the third quartile, and squares the fourth quartile of maternal dietary glycemic index and load, respectively. Results are based on repeated measurement regression models and reflect the differences in gestational-age-adjusted SDS scores of fetal head circumference, length, and weight growth for the three highest maternal dietary glycemic index and load quartiles compared the lowest maternal dietary glycemic index and load quartile (reference group represented as zero line). The models were adjusted for gestational age at study enrollment, maternal age, parity, educational level, pre-pregnancy BMI, early pregnancy total daily energy intake, smoking during pregnancy, alcohol use during pregnancy, daily nausea, and vomiting during early pregnancy and fetal sex. We only observed a significant interaction for maternal dietary glycemic index quartiles with gestational age for fetal length. Regression coefficients for gestational age-independent and gestational age-dependent effects are given in Supplementary Table S3.

