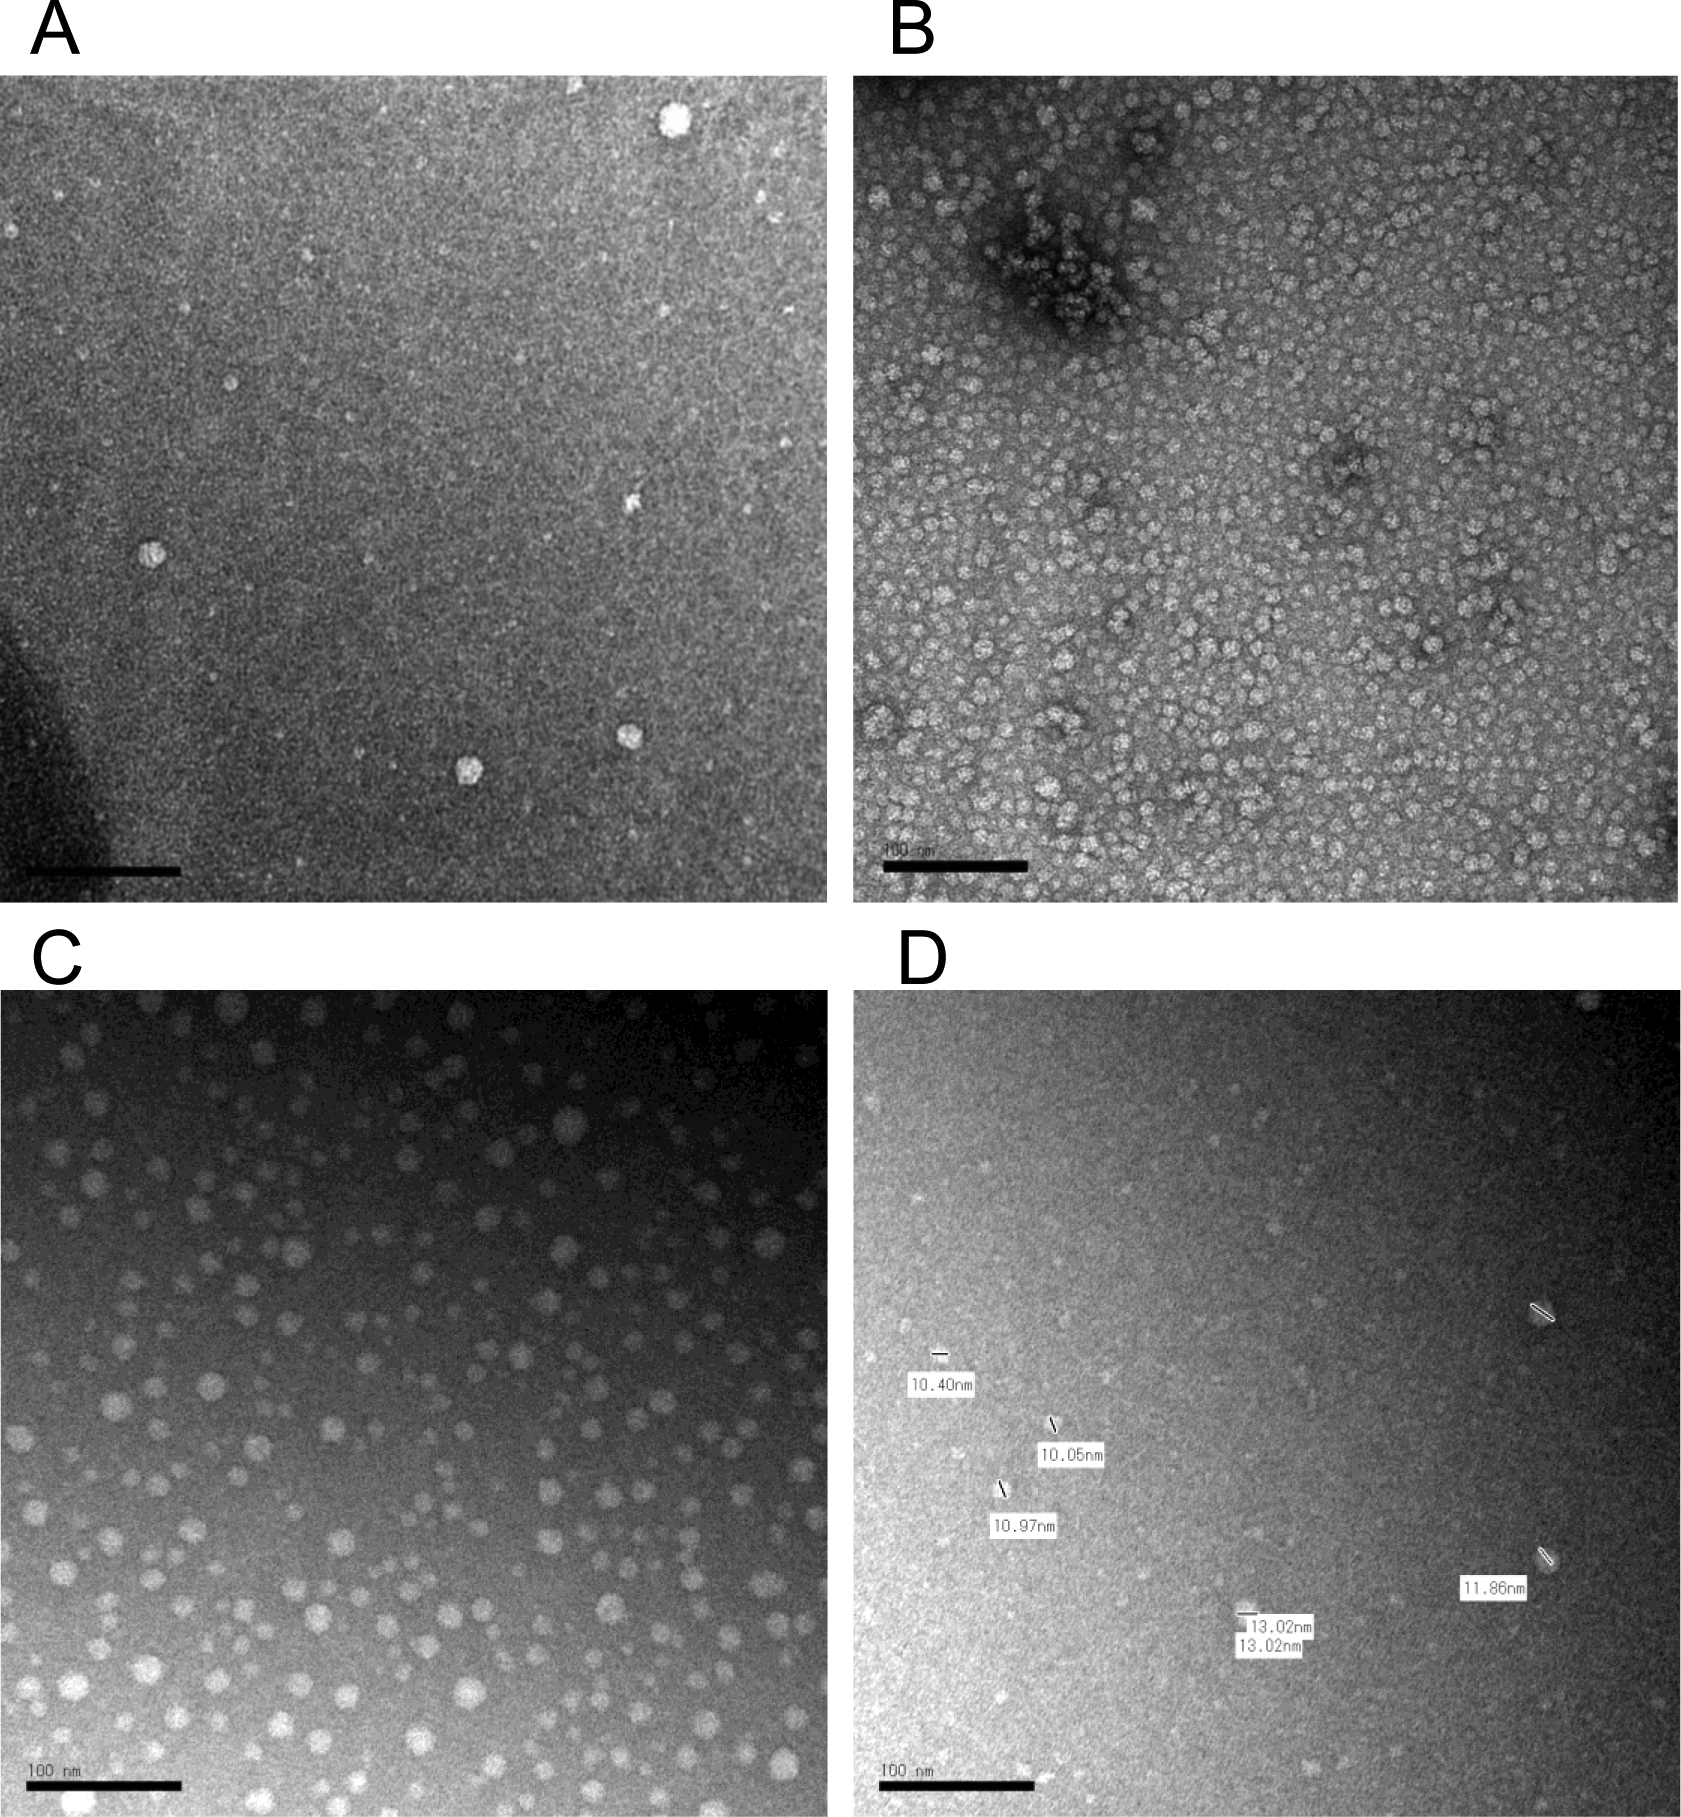
Figure 5.

Negative staining transmission electron microscopy (TEM) image of HDL in cerebrospinal fluid (CSF) and in plasma. The contrast was obtained by a 2% uranyl acetate solution. The typical HDL particles in mouse CSF (A), in human plasma (B), and in rat CSF (C, D). The scale bar indicates 100 nm. Short bars in the image D was used for calibrations of each particle diameter lengths which indicated by side.
