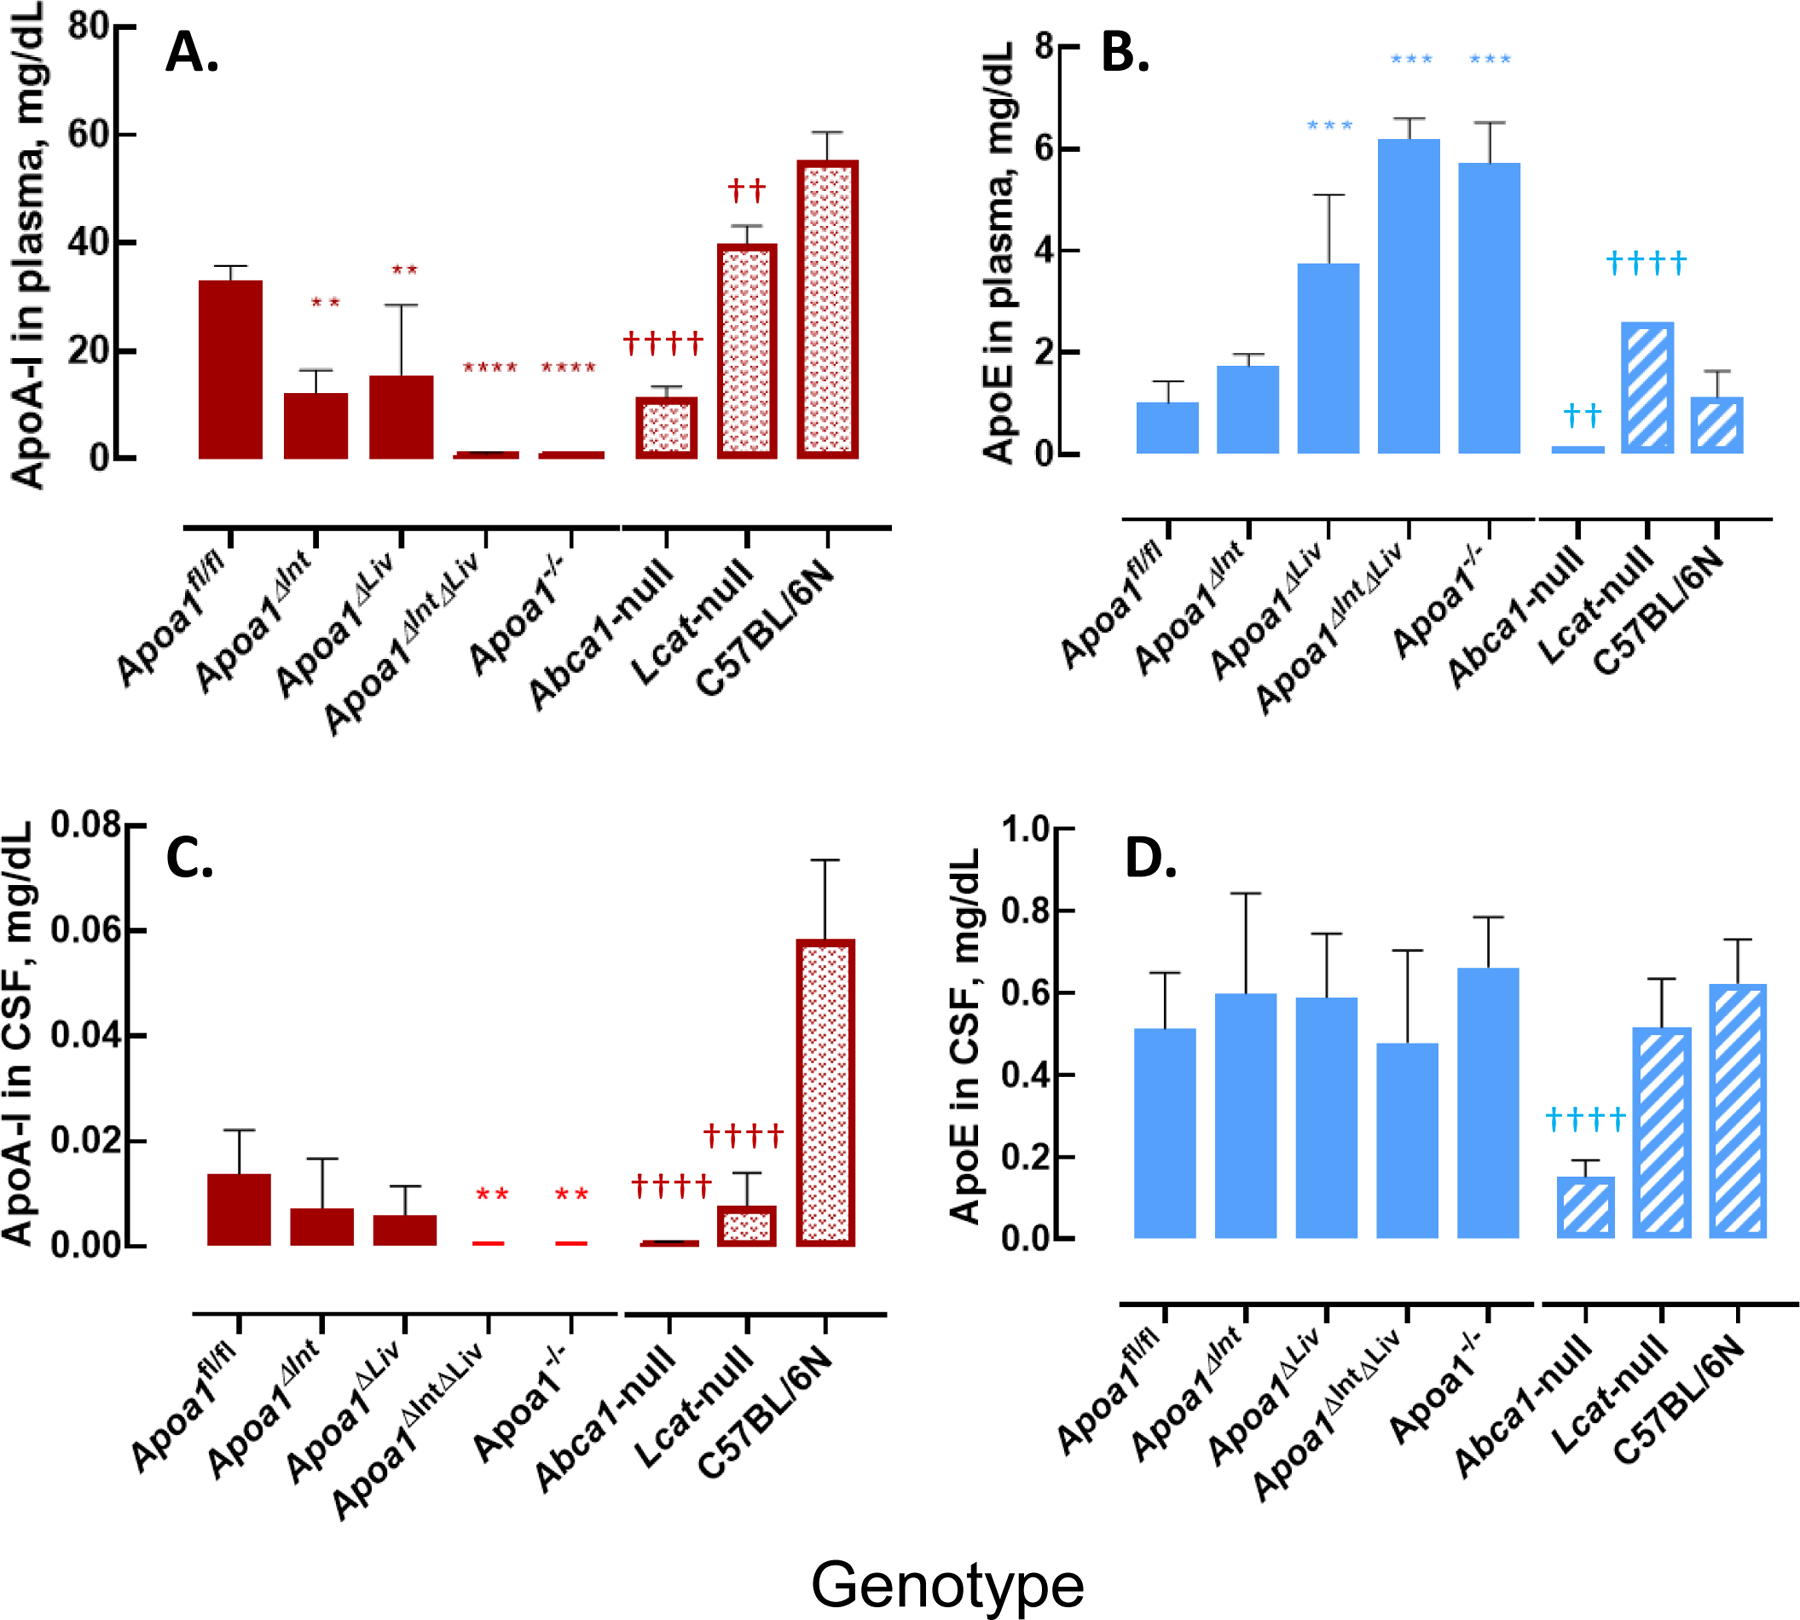
Figure 6.

ApoA-I and apoE level in mouse plasma and mouse CSF. A: apoA-I level in mouse plasma. B: apoE level in mouse plasma. C: apoA-I level in mouse CSF. D: apoE level in mouse CSF. Asterisks indicate the statistical difference compared to the Apoa1fl/fl mice (**: p<0.01, ***: p<0.001, ****:p<0.0001). Daggers indicate the statistical difference compared to the C57BL/6 N mice (††: p<0.01, ††††: p<0.0001).
