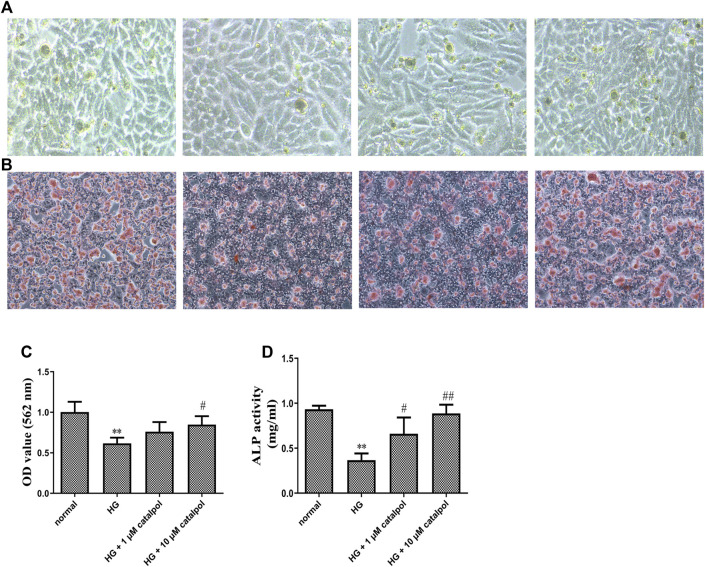
FIGURE 4.
Effect of catalpol on osteogenic differentiation and calcification of MC3T3-E1 cells treated by high glucose. (A) Cell differentiation was measured by ALP staining. (B) Cell calcification was measured by Alizarin Red staining. (C) Catalpol reversed cell calcification according to microplate reader of Alizarin Red staining measured at 562 nm. (D) Catalpol increased cell ALP activity treated with high glucose. The data were expressed as the mean ± SD. **p < 0.01 vs. control and ## p < 0.01, and # p < 0.05 vs. model.

