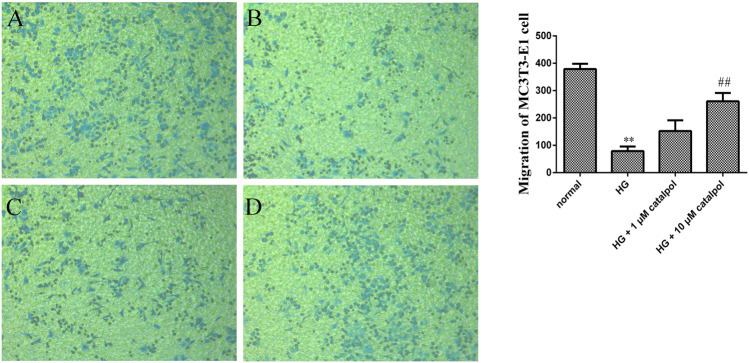
FIGURE 7.
Effect of catalpol on migration of MC3T3-E1 cells treated by high glucose. Cell invasive capacity was measured by the transwell cell migration assay. The level of migration was statistically evaluated, as shown in the column. (A) Normal group. (B) HG group. (C) HG + 1 μM catalpol. (D) HG + 10 μM catalpol. The data were expressed as the mean ± SD. **p < 0.01 vs. control and ## p < 0.01 vs. model.

