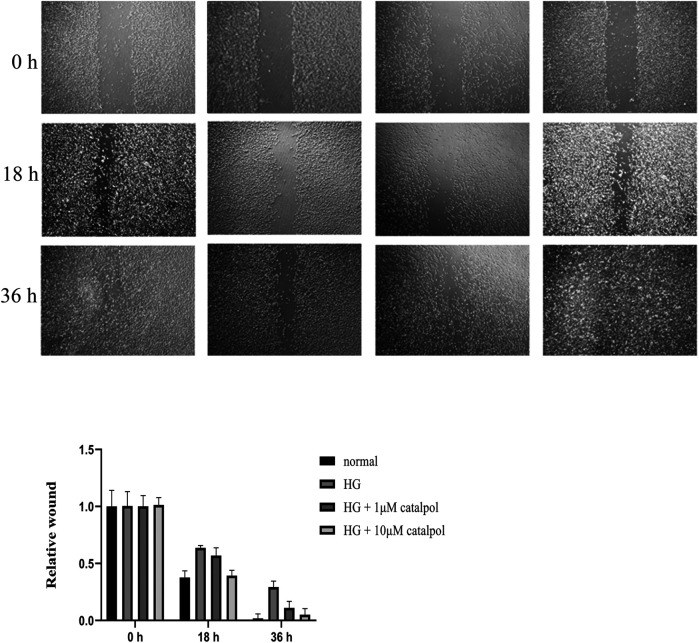
FIGURE 8.
Effect of catalpol on migration of MC3T3-E1 cells treated by high glucose. Cell migration was measured by the wound-healing assay. The level of migration was statistically evaluated, as shown in the column. The data were expressed as the mean ± SD. **p < 0.01 vs. control and ## p < 0.01 vs. model.

