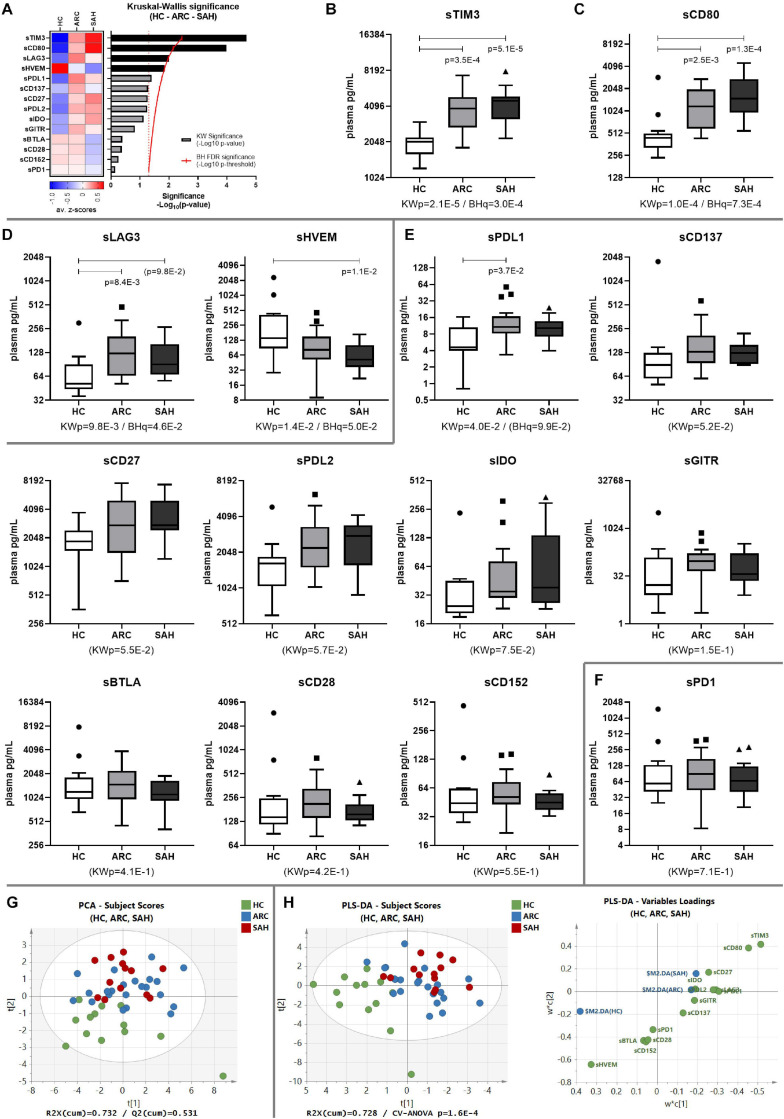
FIGURE 1.
Soluble-CR networks in ALD patients. (A) Significance plot summarizing the soluble-CR differential expression in HC, ARC and SAH; soluble-CR measurements: standardized z-scores; significance: –Log10(p-value); red continuous line: BH significance threshold; red dotted line: p = 0.05; black bars: significantly different soluble-CRs; gray bars: non-significant soluble-CRs. (B) Soluble-TIM3 is the most different and highly upregulated soluble-CR in patients vs. HC, followed by (C) soluble-CD80, (D) soluble-LAG3 and soluble-HVEM. (E) Soluble-CRs comparable between groups. (F) Soluble-PD1 is the most similar in patients and controls. KWp, raw Kruskal–Wallis p-value; BHq, FDR-adjusted q-value; p, significant multiple comparisons with Dunn’s correction. Boxplots (median, IQR, ± Tukey’s whiskers/outliers) ordered by decreasing statistical significance. (G) Subject clustering by unsupervised PCA. (H) 3-way supervised clustering by PLS-DA, with superimposition of HC, ARC, and SAH categories; soluble-TIM3 is the main driver of supervised clustering, as shown in the ‘Variables Loadings’ plot; subject re-classification based on this model: 70.8% accuracy (HC-ARC-SAH = 100%–86.4%–15.4%, Fisher’s p = 8.7E-9). ‘Subject Scores’ plots: each dot represents a subject; ‘Variables Loadings’ plots: each dot represents a soluble-CR.

