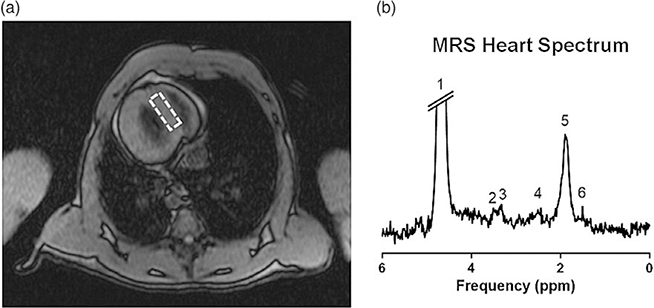
Fig. 4.
Example of a hydrogen-1 magnetic resonance spectrum (1 H-MRS) from a baboon heart. (a) Scout image is used to define the position in the interventricular septum (dashed rectangle) from which the 1 H-MRS data is sampled. (b) Sample spectrum from a prior study identifying six major resonances, including three peaks of triglyceride (4, 5, and 6) and single peaks of creatine (3), trimethyl-ammonium compounds (2), and water (1).

