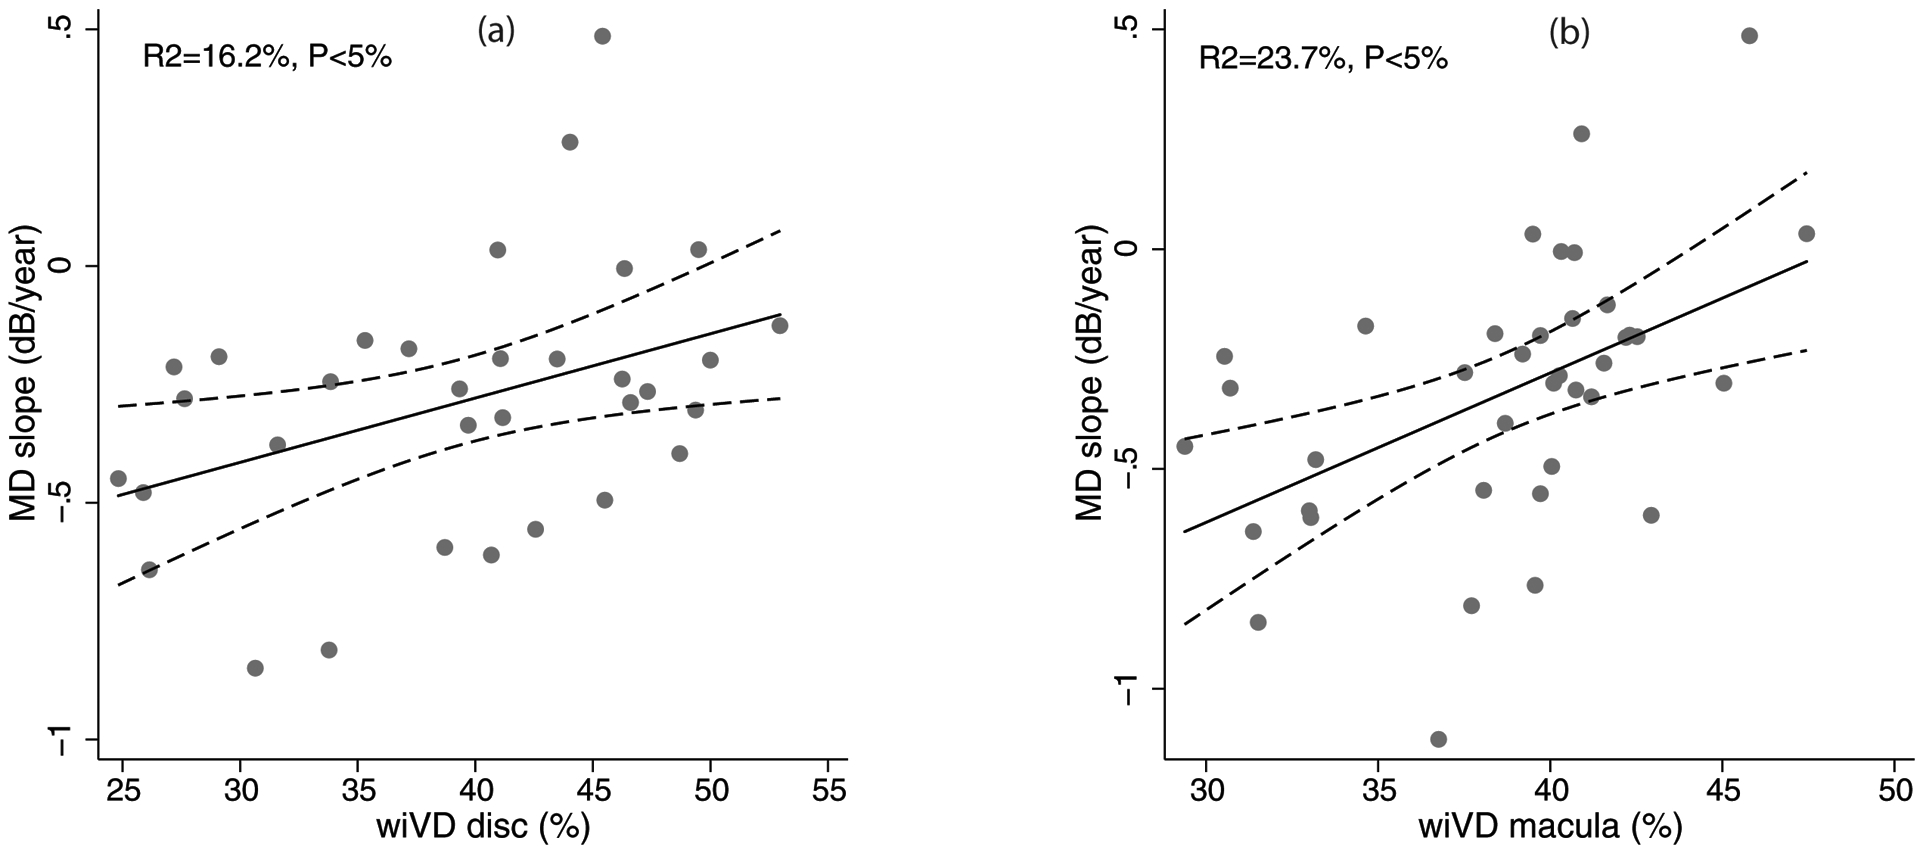
Figure 1.

Scatterplots showing the relationship between rate of mean deviation (MD) change (MD slope) and whole enface vessel density of disc scan (wiVD disc, a), and whole enface vessel density of macular scan (wiVD macula, b). R2 represents the coefficient of determination of the relationship.
