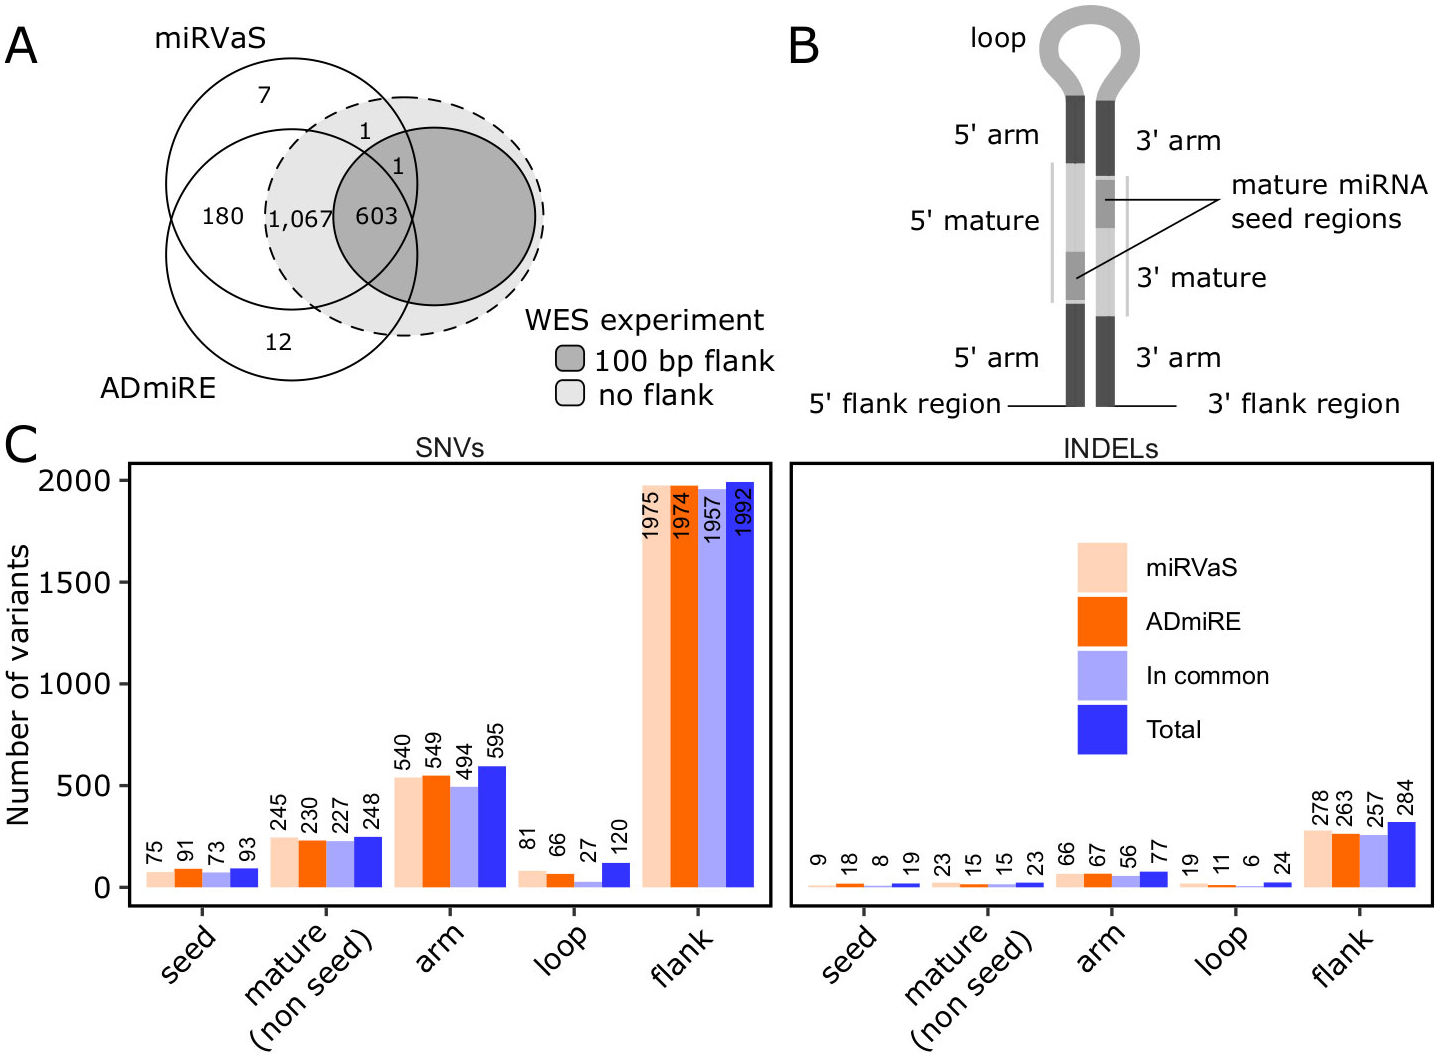
Figure 2. Variants stratified by miRNA gene regions.

(A) Number of miRNA genes from miRVaS and ADmiRE databases that were covered in the WES experiment. (B) Diagram depicting miRNA stem-loops structure with highlighted distinct miRNA gene regions (adapted from (16)). In our analyses 5’ and 3’ flanks span 100 bps on each end of the miRNA gene. (C) Number of SNVs and INDELs within distinct regions of miRNAs as outlined in (B) and per tool as indicated by the color legend.
